Tencent Stock Technicals Today: Gains 2.63%, Momentum Weakens
On September 22, 2026: price 430.00 HKD, trend downtrend, RSI 44.7, support 419.00, resistance 455.20. technical analysis of tencent stock.

Tencent Holdings traded in Hong Kong with 0700.HK at HKD 430.00 on 21 September 2026 at 08:30 WIB, up 2.63% from the previous close of 419.00, but the rebound still sits inside a broader weak structure that has kept the stock below its short- and medium-term trend lines. The latest move matters less for its size than for its location: Tencent is still trading below the SMA20 at 436.92 and well under the SMA50 at 451.95, which tells the market that sellers have not fully lost control even after today’s gain. The price is also only around the lower third of its recent operating range, as shown in the chart, which means the bounce has yet to prove it can turn into a trend change.
Trend & Price Action
The stock remains in a downtrend, with the SMA20 slope at -1.03% over 5 days. That slope is important because it shows the short-term average is still rolling lower, so even a positive daily move does not automatically reset the trend. Tencent’s last price is sitting between the 20-hour support at 419.00 and the 20-hour resistance at 455.20, while the 3-month range of 497.80 / 411.00 shows the shares are much closer to the lower end than the upper end. In plain terms, the market has not yet rewarded the stock with a clean recovery; it is still trying to build a floor.
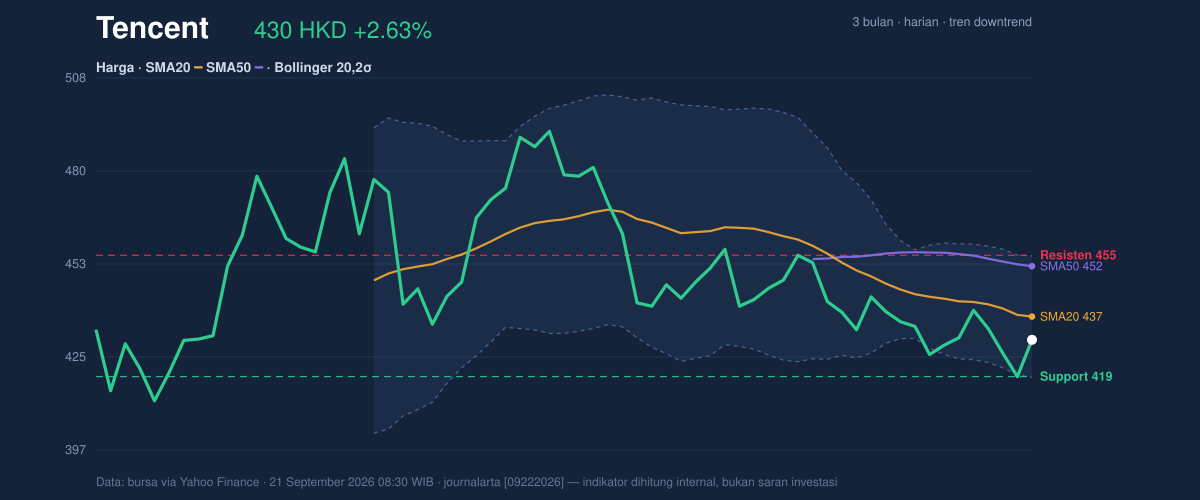
The absence of a new MA-cross also matters. Without a fresh crossover to signal a trend shift, the chart is still leaning on price action alone, and price action is not yet strong enough to claim a reversal. The session’s close above the prior close is constructive, but the fact that the stock remains below the SMA20 means rallies are still meeting overhead supply.
Oscillators & Momentum
Momentum indicators are not confirming a breakout. The RSI at 44.7 is neutral, which usually means the stock is neither oversold enough to suggest panic selling nor strong enough to show bullish conviction. The Stochastic %K at 38.5 and %D at 18.8 are also neutral, but the gap between the two lines suggests the short-term rhythm is improving from weak levels without yet becoming decisively strong. That is a subtle difference: momentum is no longer deeply depressed, but it is still not pointing to an aggressive upside push.
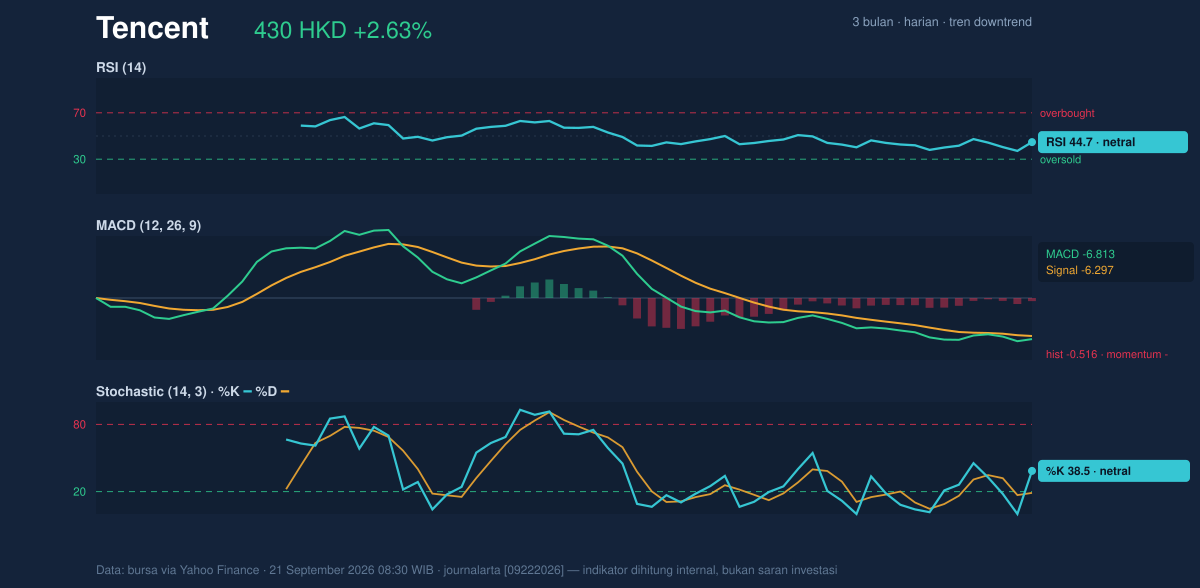
The more telling signal comes from MACD at -6.813, below the signal line at -6.297, with a histogram of -0.516. MACD is a trend-following momentum tool, and a negative histogram means downside momentum still has the upper hand. So while RSI and Stochastic say the stock is not stretched, MACD says the underlying trend has not yet turned. That combination usually describes a market that can bounce, but struggles to sustain one without a fresh catalyst.
Volatility & Volume
Volatility is present, but not extreme. The ATR(14) at 10.03, equal to 2.3% of price, indicates the stock can still move meaningfully in a day, but the Bollinger band width at 8.3% is described as normal rather than compressed. That means the setup is not screaming for an explosive move; instead, it suggests a fairly standard trading environment where price is likely to respect nearby levels unless volume expands sharply. The %B at 31% places Tencent in the lower part of the band, which is consistent with a weak-to-neutral posture rather than a strong overbought rebound.
Volume adds a useful caution. Last trade volume of 19,669,333 is only 1.1x normal versus the 20-session average of 17,852,677, so participation was decent but not exceptional. More importantly, OBV is falling, and that often signals that distribution has been heavier than accumulation over time. In simple terms, the market has been trading, but the balance of that trading has not yet shifted decisively in favor of buyers.
Key Levels & Scenarios
The chart’s key battleground is clear: 419.00 is the nearest support, and 455.20 is the nearest resistance. The Bollinger lower band at 418.82 sits almost on top of support, which makes that zone especially important. If the stock can hold above this area and then reclaim the SMA20 at 436.92, the next test becomes the upper side of the recent range. If it fails to hold 419.00, the chart opens the door back toward the 3-month low of 411.00, where sentiment would likely become more fragile.
The current position at roughly 30% of the recent range says Tencent is still closer to repair than recovery. The market has stopped falling hard, but it has not yet done enough to prove a sustained turn.
Technical Verdict: HOLD (wait & see)
- Reason 1: Price is still below SMA20 at 436.92 and SMA50 at 451.95, so the trend structure remains weak.
- Reason 2: MACD is negative with a -0.516 histogram, showing downside momentum still dominates.
- Reason 3: RSI 44.7 and Stochastic 38.5/18.8 are neutral, which supports a pause rather than a confirmed reversal.
- Verdict invalidated if price breaks below 419.00, because that would weaken the nearest support and expose the lower range.
- Ideal Entry Range: 419.00 to 436.92
- Exit Target: 455.20
- Stop Loss protection: below 418.82, with 411.00 as the deeper risk marker
In plain English: the stock is trying to stabilize, but the chart still needs proof before the rebound can be trusted.
“Until Tencent can reclaim the 436.92 area with stronger momentum, this is still a market asking for patience, not conviction.”
Summary Data Tencent
| Last price | 430.00 HKD |
| Change 1 day / 5 days / 1 month | 2.63% / -0.14% / -2.27% |
| Trend / MA-cross | downtrend / none |
| SMA20 / SMA50 | 436.92 / 451.95 |
| RSI (14) / Stochastic %K | 44.7 / 38.5 |
| Bollinger %B / ATR | 31% / 10.03 |
| Support / Resistance 20 days | 419.00 / 455.20 |
| Data as of | 21 September 2026 08:30 WIB |



