Singtel Stock Drops 0.46%, Testing Support Level In Focus
On September 22, 2026: price 4.33 SGD, trend sideways, RSI 36.1, support 4.33, resistance 4.56. technical analysis of singtel stock. Singtel Stock Drops — full…

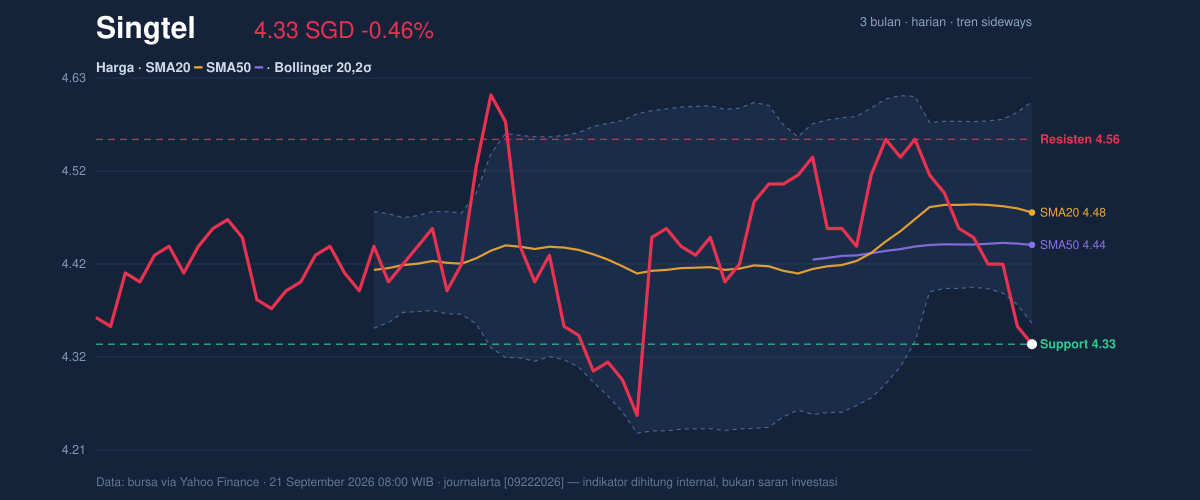
Singapore Telecom’s Singtel fell to SGD 4.33 on SGX by 21 September 2026, 08:00 WIB, slipping 0.46% from the previous close as the stock stayed pinned at the lower edge of its recent range. The move matters less for its size than for what it says about positioning: the shares are trading below the SMA20 at 4.48 and even under the Bollinger lower band at 4.35, a sign that the market is pressing the stock faster than the recent average can absorb. As shown in the chart, that places Singtel in a technically fragile spot, but not yet in a clean breakdown.
Trend & Price Action
The broader pattern is still sideways, but the slope of the SMA20 at -0.19% over 5 days shows that the short-term drift has turned negative. That is a subtle but important shift: sideways markets can look calm until the moving average starts tilting down, which often means sellers are gaining control at the margin even if there is no dramatic selloff. The stock is also sitting below the SMA50 at 4.44, so both the short and medium-term trend markers are now stacked above price, a configuration that typically keeps rallies contained unless momentum improves.
The absence of a fresh MA-cross means there is no new trend signal from the moving averages yet. That matters because crossovers often confirm a change in regime; without one, the market is still in a waiting pattern, with price action doing the talking. The 3-month range adds context: Singtel is closer to the 3-month low of 4.19 than the 3-month high of 4.70, which tells readers the stock has already surrendered a meaningful part of its recent recovery without yet reaching an extreme floor.
Oscillators & Momentum
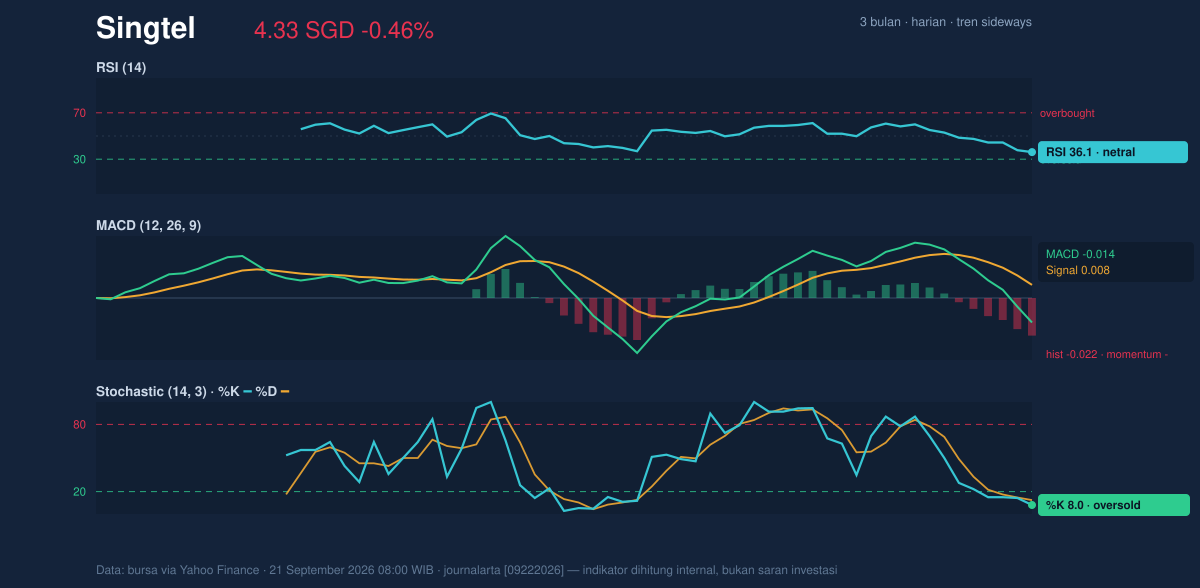
The momentum gauges are mixed, and that mix is the main reason this name does not read as a clean downtrend. The RSI at 36.1 is still in neutral territory, but it is leaning weak enough to show that buyers have not regained initiative. By contrast, the Stochastic %K at 8.0 and %D at 12.4 are in oversold territory, which usually means the stock is stretched on the downside in the short run. In plain language, the selling may be tiring, but oversold does not automatically mean a rebound; it only says the market is compressed enough to bounce if fresh demand appears.
That caution is reinforced by the MACD at -0.014, below its signal line at 0.008, with a histogram of -0.022. This combination says momentum is still negative, and the recent price action has not yet reversed that pressure. As shown in the chart, the oscillators are not aligned in one direction: Stochastic is flashing short-term exhaustion, while MACD is still confirming downside bias. That kind of split often precedes either a brief rebound or another leg lower, depending on whether price can reclaim nearby resistance quickly.
Volatility & Volume
The Bollinger Bands are telling a more nuanced story than the headline weakness suggests. Price is below the lower band at 4.35, while the band width is only 5.6%, described here as a squeeze. A squeeze means volatility has compressed, and compressed volatility often precedes a sharper move once price escapes the range. The fact that Singtel is trading with %B at -10% indicates it is not merely near the lower band, but already outside the usual band envelope, which can happen in persistent weakness or during a temporary overshoot.
Volume does not yet confirm a decisive shift. Last volume was 14,655,200, below the 20-day average of 20,464,197, or 0.7× normal. That matters because falling prices on lighter turnover can mean sellers are still in control, but not with forceful conviction; equally, it can mean buyers are absent rather than aggressively bearish. The OBV is falling, which is the more important clue: on-balance volume tracks whether volume is flowing into or out of the stock, and a declining OBV says the distribution trend is still intact even as the price hovers near support. With ATR at 0.07, or 1.6% of price, daily movement remains moderate, so a break of support would not need a large catalyst to matter.
Key Levels & Scenarios
The most immediate technical line in the sand is support at 4.33, which is also the latest price. That means the stock is sitting directly on support rather than comfortably above it, and that usually raises the odds of a quick decision point. The next reference is resistance at 4.56, which aligns closely with the upper side of the recent range and would need to be reclaimed before the chart can argue for recovery. The Bollinger middle band at 4.48 and the SMA50 at 4.44 sit in between, creating a layered ceiling that price must work through one step at a time.
If 4.33 fails, the chart opens toward the lower part of the 3-month range near 4.19. If price reclaims 4.44 to 4.48, the tone improves because that would put Singtel back above both the medium-term average and the Bollinger midpoint. A move through 4.56 would then matter because it would show the market can escape the current compression rather than just bounce inside it.
Technical Verdict: HOLD (wait & see)
- Reason 1: Price is below the SMA20 at 4.48 and below the SMA50 at 4.44, so trend structure remains weak.
- Reason 2: MACD is negative and the OBV is falling, which means momentum and participation are still leaning to the downside.
- Reason 3: Stochastic is oversold and Bollinger width is 5.6%, so the stock is compressed enough for a sharp move, but direction is not yet confirmed.
- Verdict invalidated if price breaks above 4.56, because that would challenge the current resistance structure and weaken the bearish setup.
- Ideal Entry Range: 4.33 to 4.35, where support and the lower Bollinger band sit.
- Exit Target: 4.44 to 4.48, the SMA50 and Bollinger middle band area.
- Stop Loss protection: below 4.19, the 3-month low reference.
In plain English, Singtel is near a technical decision point, but the chart still needs proof before the weakness can be treated as finished.
Summary Data Singtel
| Last price | 4.33 SGD |
| Change 1 day / 5 days / 1 month | -0.46% / -2.91% / -2.04% |
| Trend / MA-cross | sideways / none |
| SMA20 / SMA50 | 4.48 / 4.44 |
| RSI (14) / Stochastic %K | 36.1 / 8.0 |
| Bollinger %B / ATR | -10% / 0.07 |
| Support / Resistance 20 days | 4.33 / 4.56 |
| Data as of | 21 September 2026 08:00 WIB |



