Alibaba Momentum Gains: Stock Gains 1.95% (September 23, 2026)
On September 23, 2026: price 114.80 HKD, trend sideways, RSI 55.7, support 105.10, resistance 116.60. technical analysis of alibaba stock.

Alibaba Group’s Hong Kong-listed shares rose to HKD 114.80 on Monday, moving further above the short-term average but still below a key longer-term gauge, as traders weighed a firmer weekly rebound against a broader sideways pattern on HKEX.
The move matters because it shows demand is still present, but not yet decisive. A stock that can climb while sitting in a range is often telling the market that buyers are willing to step in on dips, yet they have not fully overpowered overhead supply. In plain terms: the share price is improving, but it is still negotiating with resistance rather than breaking cleanly away from it.
Trend & Price Action
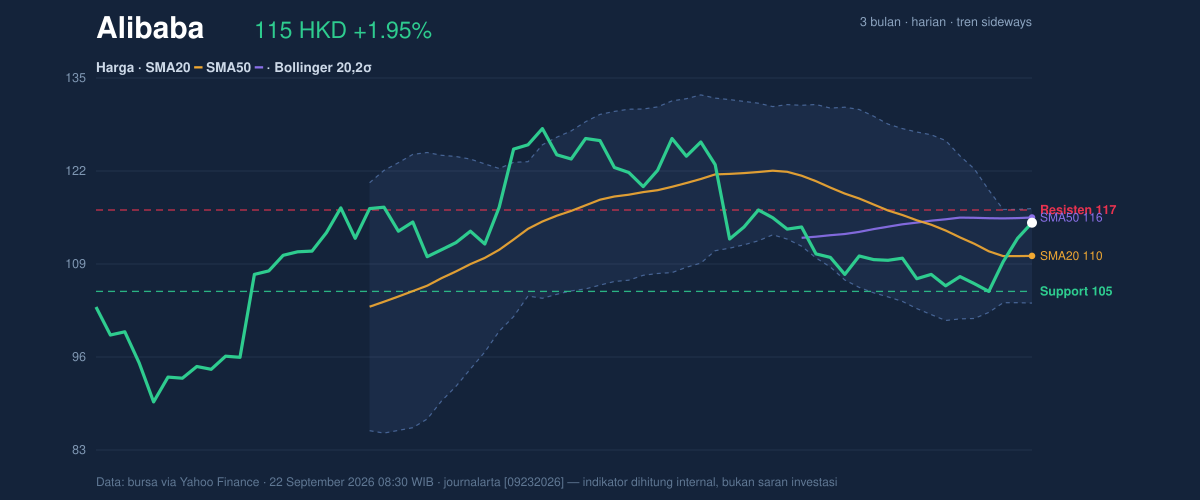
As shown in the chart, Alibaba is trading above its SMA20 at HKD 110.13 but below its SMA50 at HKD 115.54, a setup that usually signals short-term recovery inside a broader neutral structure. The sideways trend label is reinforced by the SMA20 slope of -2.31% over 5 days, which means the recent short-term average is still leaning lower even as price has bounced.
That combination is important. When price sits above the faster average but below the slower one, the market is often in a transition zone: the latest buying has improved sentiment, yet the longer trend has not fully confirmed a reversal. The lack of a new MA-cross also matters. A fresh crossover between moving averages often marks a more durable shift in trend; without it, this is still a range-bound recovery rather than a trend breakout.
The share is also trading near the upper part of its recent band, with price at 84% of the 20-hour range. That tells us it is not languishing near support anymore. It is pressing against the upper half of the box, where traders usually start asking whether momentum can carry price through resistance or whether the move will stall.
Oscillators & Momentum
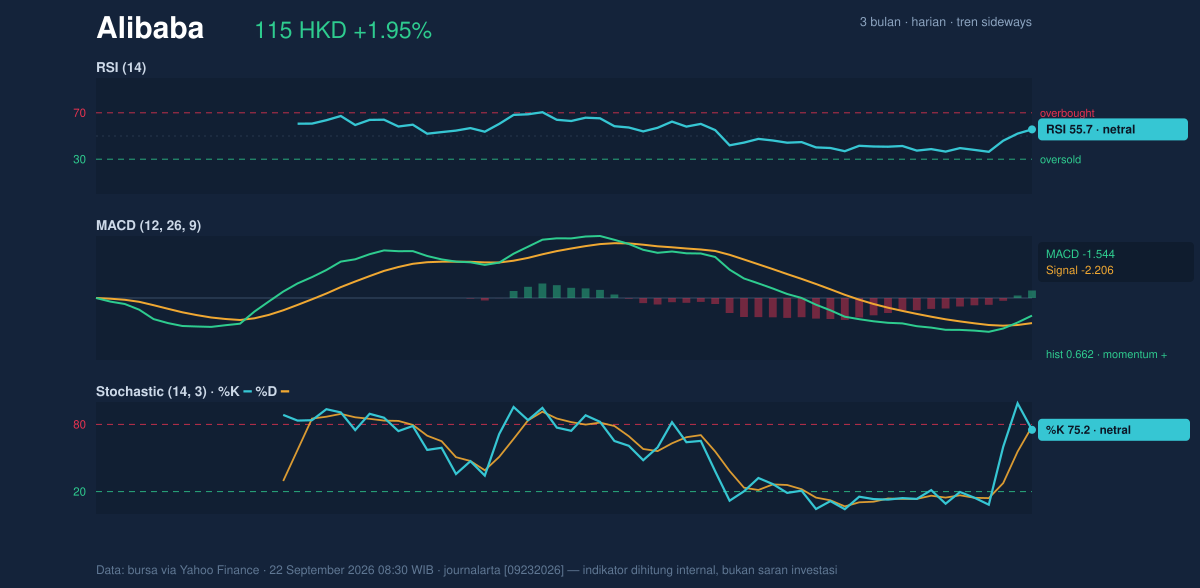
The momentum picture is constructive, but not euphoric. The RSI at 55.7 is neutral, which means the stock is neither overbought nor oversold. That is a healthy reading for a stock trying to extend a rebound: it suggests there is room for further upside before momentum becomes stretched. The Stochastic %K at 75.2 and %D at 78.0 sit in neutral territory but close to the upper end, implying the recent lift has been strong enough to push the stock toward the top of its short-term range without yet flashing a clear exhaustion signal.
The more telling indicator is the MACD at -1.544 versus signal at -2.206, with a positive histogram of 0.662. For general readers, MACD measures whether recent price action is gaining or losing force. Here, the fact that MACD remains below zero but is above its signal line means downside pressure has eased and upward momentum is improving, though the stock has not yet fully flipped into a strong bullish regime. In other words, the trend is mending before it is healed.
That distinction matters because momentum is often the bridge between a bounce and a breakout. Right now, Alibaba has a bridge, but it is still under construction.
Volatility & Volume
Volatility is moderate, not extreme. The ATR(14) of 3.40, equal to 3.0% of price, suggests daily swings are meaningful but not disorderly. The Bollinger Bands show the stock near the upper end of its envelope, with %B at 85% and the upper band at HKD 116.80. %B indicates where price sits within the band structure; a reading this high means the shares are pressing toward the top of the recent volatility range. The 12.1% Bollinger width is described as normal, so this is not a squeeze waiting to explode, but neither is it an overstretched, frantic market.
Volume adds an important layer of confirmation. Last session turnover of 123,942,194 shares was about 1.7 times the 20-hour average of 71,247,720, and OBV is rising. OBV, or on-balance volume, tracks whether volume is flowing into up days or down days. A rising OBV alongside a price bounce suggests buyers are not merely appearing on thin trading; they are participating with conviction. That is a meaningful signal because rallies backed by heavier volume tend to be more credible than those built on quiet trading.
Still, volume confirmation alone does not guarantee a breakout. It simply increases the odds that the current move has real sponsorship behind it.
Key Levels & Scenarios
The nearest resistance is HKD 116.60, closely followed by the Bollinger upper band at HKD 116.80. That creates a tight overhead zone where the stock may either pause or attempt a breakout. On the downside, the main support is HKD 105.10, which also sits well below the current price and defines the lower edge of the recent trading structure.
The location of price matters here: Alibaba is already near the top of the 20-hour range, so the next move is less about whether it can continue rising in a vacuum and more about whether it can absorb supply around 116.60 to 116.80. If it clears that pocket, the chart would begin to look less like a rebound and more like a trend extension. If it fails there, the market would likely revert to testing the middle of the range first, then support.
Alibaba is improving, but it is still trading under nearby resistance and has not yet completed a trend reversal.
Technical Verdict: HOLD (wait & see)
- Reason 1: Price is above SMA20 and OBV is rising, which supports the rebound.
- Reason 2: MACD histogram is positive, showing momentum is improving even though MACD remains below zero.
- Reason 3: RSI is neutral and price is pressing near Bollinger upper band resistance, so upside is constructive but not yet confirmed.
- Verdict invalidated if price breaks below HKD 105.10.
- Ideal Entry Range: HKD 110.13 to HKD 114.80
- Exit Target (Target Price): HKD 116.60 to HKD 116.80
- Stop Loss protection: HKD 105.10
For non-traders: the chart says Alibaba is recovering, but it still needs to prove it can get through the nearby ceiling at HKD 116.60 to HKD 116.80.
Summary Data Alibaba
| Last price | 114.80 HKD |
| Change 1 day / 5 days / 1 month | 1.95% / 7.09% / 0.53% |
| Trend / MA-cross | sideways / none |
| SMA20 / SMA50 | 110.13 / 115.54 |
| RSI (14) / Stochastic %K | 55.7 / 75.2 |
| Bollinger %B / ATR | 85% / 3.40 |
| Support / Resistance 20 days | 105.10 / 116.60 |
| Data as of | 22 September 2026 08:30 WIB |



