Tencent Stock Gains 5.02% Today, Testing Key Resistance
On September 23, 2026: price 451.60 HKD, trend sideways, RSI 56.0, support 419.00, resistance 455.20. technical analysis of tencent stock.

Tencent Holdings climbed on HKEX in Hong Kong on 22 September 2026, with the stock last changing hands at HKD 451.60, up 5.02% on the day, after a session that pushed it close to the top of its recent trading band, according to Yahoo Finance data cited from the exchange. The move matters because it was not just a one-day bounce: the price is now sitting above the short-term average, volume surged to more than three times normal, and momentum indicators are starting to line up in Tencent’s favor — even though the broader chart still looks sideways rather than decisively trending.
Trend & Price Action
The first signal is structural: Tencent is still in a sideways pattern, but the latest advance has lifted it above the SMA20 at HKD 437.40, which means the stock has recovered the near-term average price paid by traders over the past month. That is often the first sign that sellers are losing control of the immediate tape. At the same time, the stock remains just under the SMA50 at HKD 451.86, so the medium-term trend has not yet been fully reclaimed. In plain terms: the market has moved from “weak” to “trying to repair.”
The chart also shows Tencent trading near the upper edge of its Bollinger band structure, with the upper band at HKD 456.50 and the middle band at HKD 437.40. A price near the upper band usually signals strength, but when the wider trend is still sideways, it can also mean the stock is testing whether buyers have enough conviction to break out of the range rather than simply stretching the top of it.
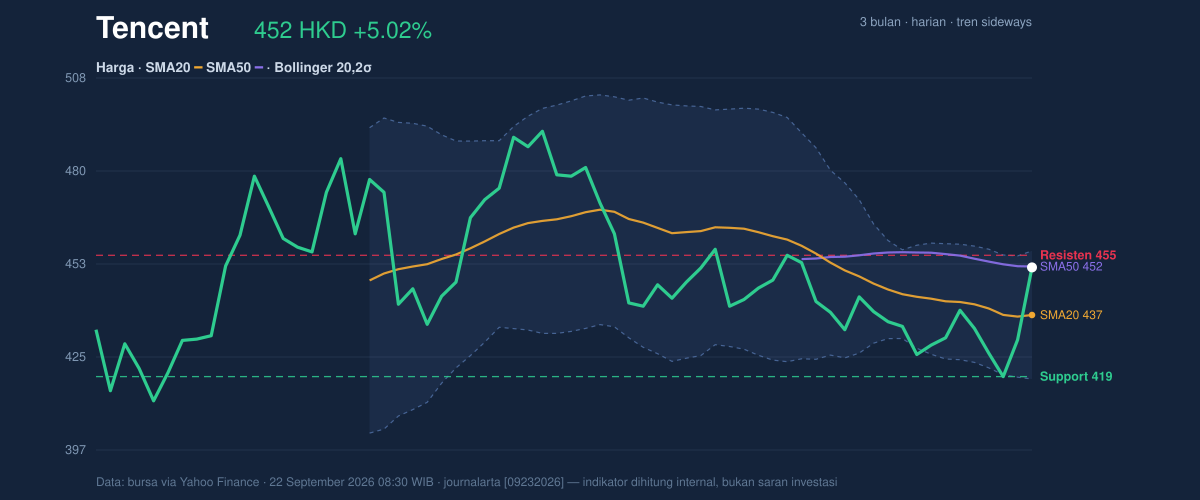
A short line, but an important one: HKD 455.20 is the immediate ceiling the market is watching.
The 20-session support and resistance map is equally telling. Tencent is trading at 90% of its recent range, with support at HKD 419.00 and resistance at HKD 455.20. That positioning says the stock is no longer hovering in the middle of uncertainty; it is pressing against the upper boundary where either continuation or rejection tends to show up quickly. The 3-month range — HKD 411.00 to HKD 497.80 — puts today’s price in the upper half, but still well below the recent peak, which reinforces the idea that this is a recovery move, not a full trend reversal.
Oscillators & Momentum
Momentum is more constructive than the trend label alone suggests. The RSI at 56.0 is neutral, not overbought, which is important because it leaves room for further upside without immediately signaling exhaustion. The Stochastic %K at 73.4 and %D at 37.3 shows short-term momentum has accelerated sharply, but it has not yet reached the kind of extreme that usually accompanies a crowded top. In other words, the stock is gaining speed, but it has not yet overheated.
The clearest improvement comes from MACD. Tencent’s MACD at -4.736 is still below zero, so the broader momentum backdrop is not fully bullish, but the signal line at -5.984 sits lower still and the histogram at 1.249 is positive. That combination matters: it means downside momentum is fading faster than the trend itself has turned up. For chart readers, this is often the early-stage “repair” phase where price starts improving before the trend headline changes.
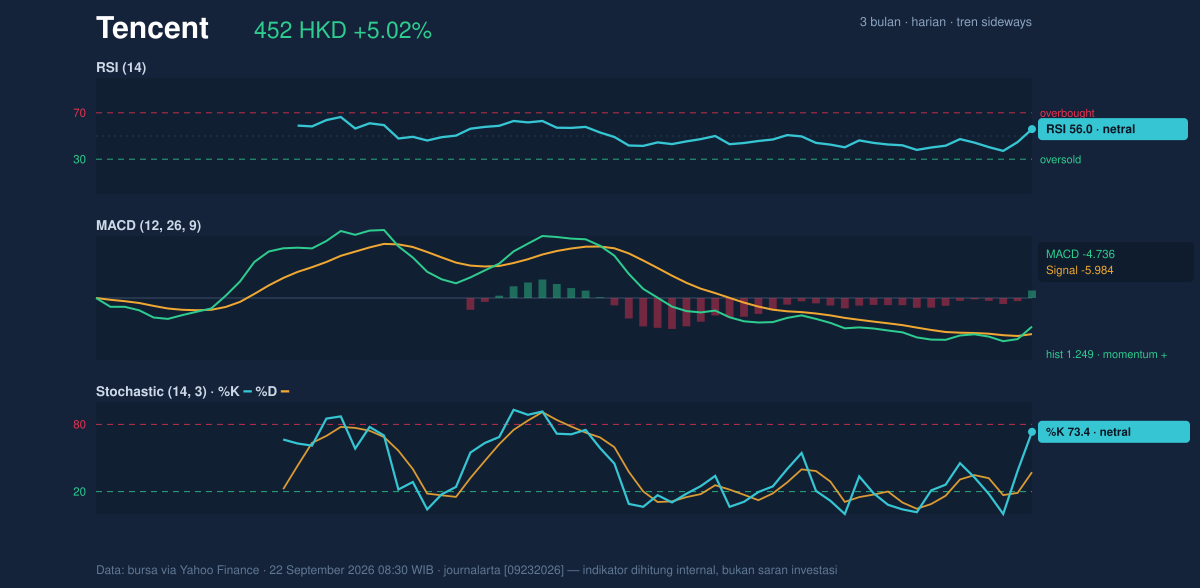
Put simply: the momentum panel is leaning better than the trend panel.
Volatility & Volume
Volatility is not screaming. The ATR at 11.96, equal to 2.6% of price, points to moderate daily movement rather than disorderly trading. That matters because a stock trying to break out of a range typically needs enough volatility to move, but not so much that every rally is immediately reversed. The Bollinger band width of 8.7% is described as normal, which suggests Tencent is not in a squeeze that would normally precede an explosive move, nor in an expansion that would imply a fully stretched breakout already underway.
Volume, however, is the most persuasive confirmation in the data set. Last session volume was 70,723,438, versus a 20-session average of 20,737,244, or 3.4× normal activity. That kind of participation often signals that the move was not accidental. More importantly, OBV is rising, which means volume has been flowing in a direction consistent with accumulation rather than distribution. When price rises on heavy volume and OBV climbs with it, traders usually read that as evidence that the move has sponsorship.
That does not guarantee follow-through. But it does mean the rally has more than just thin air underneath it.
Key Levels & Scenarios
The market is now focused on a narrow decision zone between the recent ceiling and the short-term moving averages. A sustained push through HKD 455.20 would put the stock into the upper Bollinger band zone around HKD 456.50 and open the door to a retest of the 3-month high area near HKD 497.80. If Tencent fails to clear that area, the more likely outcome is a return toward the middle band at HKD 437.40, and then the stronger floor at HKD 419.00.
The key point is that the current price is not far from resistance, so the next move matters more than the last one.
Technical Verdict: HOLD (wait & see)
HOLD (wait & see)
- RSI 56.0 and Stochastic 73.4/37.3 show improving momentum, but not a fully confirmed trend.
- MACD histogram 1.249 is positive, yet MACD -4.736 remains below zero, so the broader trend has not fully flipped.
- Volume at 3.4× average and OBV rising support the move, but price is still testing HKD 455.20 resistance and remains within a sideways structure.
Verdict invalidated if price breaks below HKD 419.00.
- Ideal Entry Range: HKD 437.40 to 451.60
- Exit Target: HKD 455.20, then HKD 456.50
- Stop Loss protection: below HKD 419.00
For non-traders: Tencent looks stronger than it did a few sessions ago, but it still needs to prove it can stay above resistance before the chart turns more decisive.
“The stock is showing real pressure against the ceiling — if it can’t hold this push, the market will know very quickly.”
Summary Data Tencent
| Last price | 451.60 HKD |
| Change 1 day / 5 days / 1 month | 5.02% / 2.92% / 2.17% |
| Trend / MA-cross | sideways / none |
| SMA20 / SMA50 | 437.40 / 451.86 |
| RSI (14) / Stochastic %K | 56.0 / 73.4 |
| Bollinger %B / ATR | 87% / 11.96 |
| Support / Resistance 20 days | 419.00 / 455.20 |
| Data as of | 22 September 2026 08:30 WIB |



