HSBC Stock Drops 1.36%, Testing Support Level In Focus
On September 23, 2026: price 159.30 HKD, trend sideways, RSI 43.5, support 159.30, resistance 167.60. technical analysis of hsbc stock.

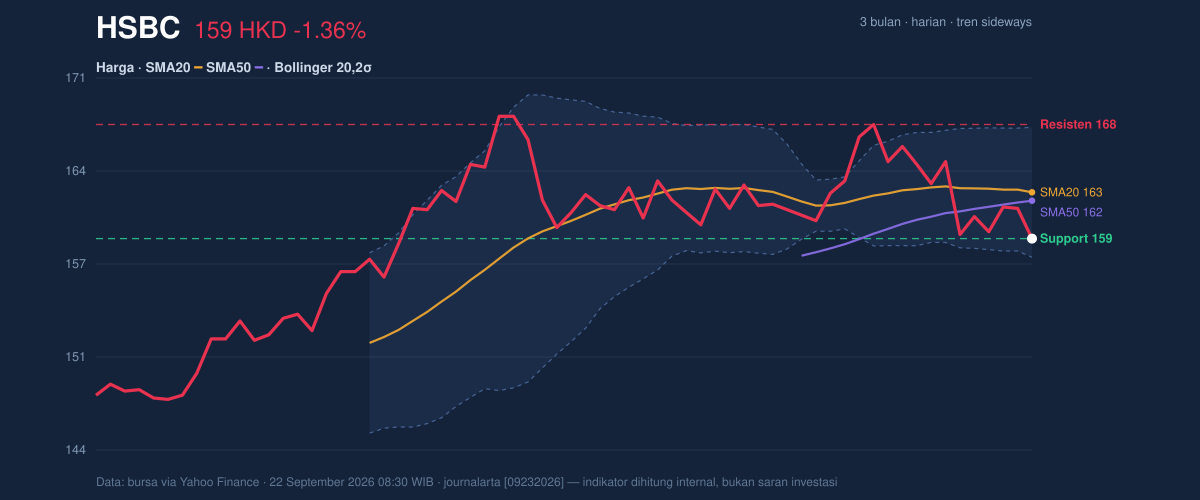
HSBC Holdings fell to HKD 159.30, down 1.36% on the session and back below both the SMA20 at 162.67 and SMA50 at 162.06, a setup that keeps the stock in a sideways pattern rather than a clean uptrend. The move matters less for its size than for where it happened: the price is now sitting right on the lower edge of the Bollinger band structure, with the chart showing %B at 14% and the band width narrowed to 5.8%. That combination often means the market is compressing energy, but the current bias is still weak because momentum has not yet turned up to confirm a rebound.
Trend & Price Action
As shown in the chart, HSBC is trading below the SMA20 and SMA50, with the SMA20 slope at -0.18% over 5 days, which signals that short-term price pressure is still leaning lower even though the broader structure remains range-bound. There is no fresh MA cross, so the chart is not delivering a decisive trend reversal signal; instead, it is telling investors that the stock is drifting inside a consolidation zone. The latest close also sits near the bottom of the 20-day support at HKD 159.30, which is important because price is now testing the floor of the recent range rather than the middle of it.
The broader range still matters. HSBC’s 3-month high is HKD 169.70 and its 3-month low is HKD 145.40, which frames the current move as a pullback inside a larger band rather than a breakdown from a long-term trend. But the fact that the stock is at 0% of the current 20-day range shows sellers have the upper hand in the very near term.
A tight range can turn quickly.
But only if momentum agrees.
Oscillators & Momentum
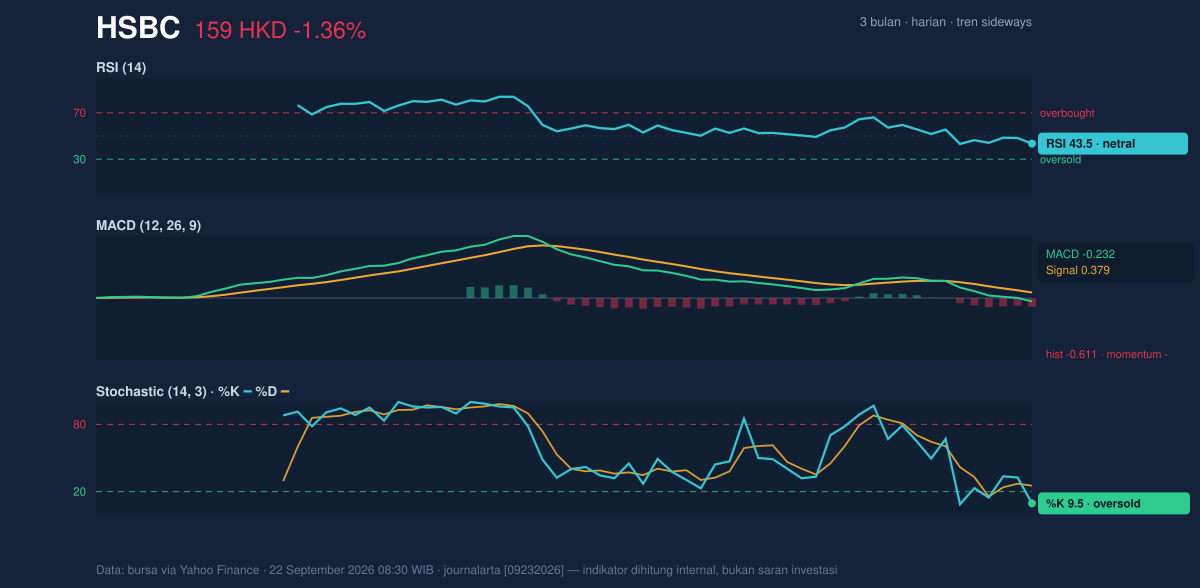
The momentum picture is mixed, and that mix is the key signal. The RSI at 43.5 is neutral, meaning the stock is not yet oversold enough to imply a strong automatic bounce, but it is also not stretched on the upside. By contrast, the Stochastic %K at 9.5 versus %D at 25.3 is firmly in oversold territory, which usually means short-term selling has become fast enough that a rebound attempt is possible. The problem is that oversold does not equal reversal; it only says pressure is extended.
That caution is reinforced by the MACD at -0.232, below its signal line at 0.379, with a histogram of -0.611. In plain language, MACD is still pointing down, and the gap between MACD and signal line shows the downside impulse has not yet been absorbed. So while Stochastic suggests the stock is stretched, MACD says the trend has not yet turned.
This is the classic “oversold, but not repaired” setup.
It can bounce. It can also keep slipping.
Volatility & Volume
Volatility is present, but not extreme. The ATR(14) at 2.79, equal to 1.8% of price, indicates a moderate daily swing range, enough for the stock to move meaningfully without behaving like a panic name. The more important volatility signal is the Bollinger setup: price is near the lower band at HKD 157.94, the upper band is HKD 167.40, and the band width has narrowed to 5.8%. A squeeze like this often precedes a sharper move, but it does not say which direction. Right now, the direction clue comes from the fact that price is hugging the lower side of the band rather than the middle.
Volume does not provide a strong contradiction. Last volume was 9,724,555, just under the 20-day average of 10,120,543, or about 1.0x normal. That means the latest decline was not accompanied by a clear surge in panic trading. Still, the OBV is falling, which matters because OBV tracks whether volume is accumulating or distributing over time. A falling OBV says the market has been distributing shares more than accumulating them, so the recent weakness has some participation behind it even if the day’s volume was ordinary.
Key Levels & Scenarios
The immediate line in the sand is the HKD 159.30 support. If that level fails to hold, the chart suggests the stock could probe lower inside the existing range, with the next reference coming from the broader 3-month low at HKD 145.40. On the upside, the first meaningful resistance sits at HKD 167.60, just above the Bollinger upper band at HKD 167.40. That matters because a move through the upper band and resistance would tell traders the squeeze has resolved upward rather than simply pausing a down move.
The center of gravity is still the SMA20 at 162.67. Reclaiming that area would be the first sign that the market is moving back toward balance, while staying below it leaves the stock vulnerable to repeated tests of support.
Technical Verdict: HOLD (wait & see)
The chart supports a HOLD (wait & see) verdict because the signals are split: the price is below both moving averages and MACD is negative, but Stochastic is oversold and Bollinger bands are tight enough to allow a sharp move in either direction.
Reasons:
- MACD remains negative, so downside momentum has not fully reset.
- Price is below SMA20 and SMA50, keeping the short-term bias soft.
- Stochastic is oversold and Bollinger bands are compressed, which raises the odds of a rebound attempt but not yet confirmation.
Verdict invalidated if price breaks below HKD 159.30, because that would confirm the current support has failed.
Ideal Entry Range: HKD 159.30–162.67
Exit Target: HKD 167.40–167.60
Stop Loss protection: below HKD 159.30
In plain English: HSBC is at a technical crossroads, where the next move is more likely to be decided by whether support at HKD 159.30 holds or gives way.
Summary Data HSBC
| Last price | 159.30 HKD |
| Change 1 day / 5 days / 1 month | -1.36% / -0.19% / -2.39% |
| Trend / MA-cross | sideways / none |
| SMA20 / SMA50 | 162.67 / 162.06 |
| RSI (14) / Stochastic %K | 43.5 / 9.5 |
| Bollinger %B / ATR | 14% / 2.79 |
| Support / Resistance 20 days | 159.30 / 167.60 |
| Data as of | 22 September 2026 08:30 WIB |



