Momentum Gains, AIA Stock Drops 1.42% Today
On September 23, 2026: price 76.25 HKD, trend uptrend, RSI 51.5, support 74.20, resistance 77.50. technical analysis of aia stock. Momentum Gains — full…

AIA Group edged down to 76.25 HKD on HKEX, slipping 1.42% from the previous close, but the broader setup still leans constructive: the shares remain above the 20-day and 50-day moving averages, MACD is positive, and volume is holding near normal. That combination matters because it suggests the pullback is more of a pause within an uptrend than a clean reversal, even though momentum is no longer accelerating. The stock is trading around the middle of its recent band, with the chart showing a market that is waiting for a fresh trigger rather than breaking down.
Trend & Price Action
The price structure remains mildly bullish. AIA is sitting just above SMA20 at 76.24 and above SMA50 at 75.85, which keeps the short-term trend aligned with the medium-term trend. The fact that price is only fractionally above the 20-day average is important: it shows the market is respecting support, but not with strong conviction. In practical terms, that often means buyers are still present, yet they are not chasing the stock higher.
The moving-average picture is also notable for what it does not show. There is no new MA-cross, so there is no fresh trend acceleration signal from the averages themselves. Instead, the chart points to a steady climb, with the SMA20 slope up 0.98% over 5 days. That rising slope tells readers the short-term direction is still upward, even if the latest session was softer.
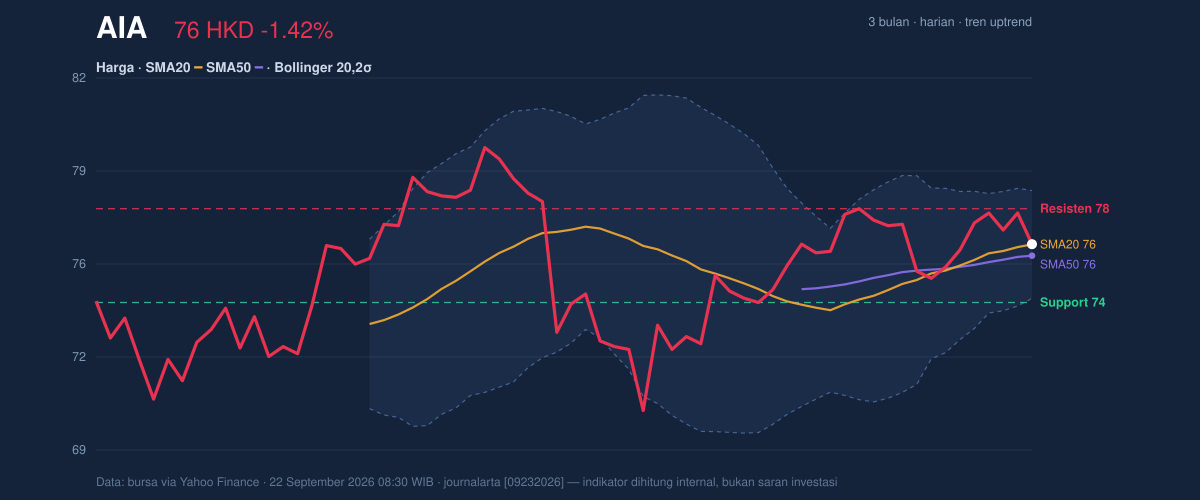
The stock is also positioned at 62% of the 20-hour range, which places it closer to resistance than support but not yet at an overextended level. That positioning matters because it leaves room for either a breakout attempt or a fade back toward the lower band. The 3-month high of 80.15 and 3-month low of 69.35 frame the larger corridor: AIA has recovered well from the lower end of that range, but it has not yet reclaimed the upper boundary.
Oscillators & Momentum
Momentum is mixed, and that is the clearest signal in the chart. RSI at 51.5 is neutral, which means the stock is neither overbought nor oversold. In plain language, the market is balanced. There is no strong momentum excess to unwind, but there is also no deep dip that would normally attract bargain-style technical interest.
The stochastic reading is similarly restrained. %K at 54.1 and %D at 63.7 are both in neutral territory, with %K below %D. That configuration tells traders that short-term upside momentum has cooled a little, though not enough to imply a decisive breakdown. It is a pause signal rather than a panic signal.
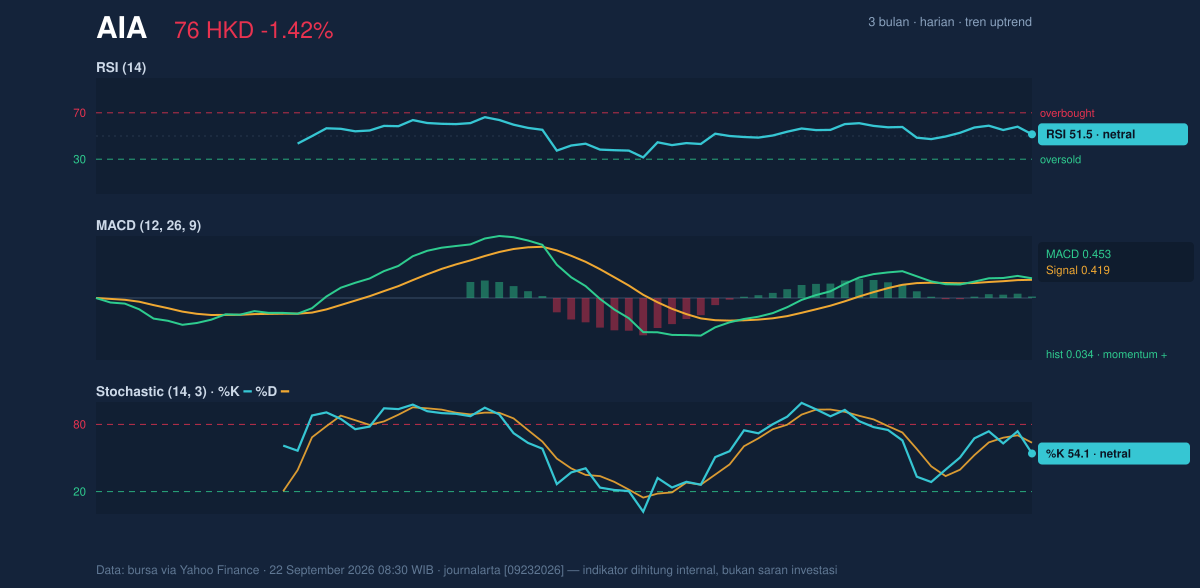
The more encouraging part is the MACD setup. MACD at 0.453 remains above the signal line at 0.419, leaving a positive histogram of 0.034. This is a small but useful confirmation that underlying momentum is still positive. The spread is narrow, so the signal is not powerful, but it does suggest the trend has not fully lost traction. When MACD stays above its signal line while RSI sits near the middle, the usual reading is that the trend is intact but needs fresh buying interest to extend.
Volatility & Volume
The volatility backdrop is quietly important. Bollinger Bands are relatively tight, with the upper band at 78.14 and the lower band at 74.34, and the band width at 5.0% indicates a squeeze. A squeeze often means the market has been compressing energy and may be preparing for a larger move. It does not say which direction that move will take, but it does tell readers that the current quiet may not last.
The %B reading of 50% reinforces that message. Price is sitting exactly in the middle of the Bollinger envelope, so the stock is not pressing the top band and not testing the lower band. That is a neutral location inside a tightening range, which usually favors patience until the next directional break.
Volume offers a modest confirmation. Last volume was 27,276,939 versus a 20-day average of 26,542,419, or roughly 1.0× normal. That is enough to say the move is being traded, but not enough to suggest strong conviction. The OBV is rising, which is the more constructive clue: on-balance volume tracks whether money flow is accumulating over time, and a rising OBV alongside a stable price often implies quiet demand is still present beneath the surface.
Key Levels & Scenarios
The chart-defined levels are straightforward. Support at 74.20 is the first line to watch, while resistance at 77.50 is the nearest ceiling. Since the stock is trading between those points, the market is effectively in a short-term holding pattern inside a narrowing band.
If AIA can clear 77.50 with stronger participation, the next technical test would be the 78.14 Bollinger upper band, and then the 80.15 three-month high. That would signal the squeeze is resolving upward. If instead the shares slip below 74.20, the short-term structure weakens and the market would be more likely to revisit the 74.34 lower Bollinger band, with the broader range low at 69.35 becoming the deeper reference point.
Technical Verdict: HOLD (wait & see)
HOLD (wait & see)
- MACD remains positive, so the trend is not broken.
- RSI and Stochastic are both neutral, which signals balance rather than urgency.
- Bollinger Bands are squeezing, so the next move may be larger, but direction is not yet confirmed.
Verdict invalidated if price falls below 74.20, where near-term support gives way.
- Ideal entry range: 74.34 to 76.24
- Exit target: 77.50 to 78.14
- Stop loss protection: below 74.20
In plain English: the chart says AIA is still holding its trend, but it has not yet proved that it is ready for the next leg higher.
Summary Data AIA
| Last price | 76.25 HKD |
| Change 1 day / 5 days / 1 month | -1.42% / 0.26% / 2.56% |
| Trend / MA-cross | uptrend / none |
| SMA20 / SMA50 | 76.24 / 75.85 |
| RSI (14) / Stochastic %K | 51.5 / 54.1 |
| Bollinger %B / ATR | 50% / 1.58 |
| Support / Resistance 20 days | 74.20 / 77.50 |
| Data as of | 22 September 2026 08:30 WIB |



