AIA Stock Gains 0.78%, Golden Cross Formed In Focus
On September 22, 2026: price 77.35 HKD, trend uptrend, RSI 58.0, support 74.20, resistance 77.50. technical analysis of aia stock. AIA Stock Gains — full…

AIA Group’s Hong Kong-listed shares were last at HKD 77.35 on 21 September 2026 at 08:30 WIB, up 0.78% on the day and sitting just below a near-term ceiling at HKD 77.50. The move matters because it leaves the stock in the upper part of its recent trading band, with buyers still in control but not yet in clear breakout territory. As shown by the chart, the share price is holding above its short- and medium-term averages, while momentum remains positive enough to keep the trend intact.
Trend & Price Action
The price structure is constructive. AIA is trading above SMA20 at HKD 76.15 and SMA50 at HKD 75.80, and the two averages have formed a golden cross, meaning the shorter average has moved above the longer one. In plain terms, that usually signals that recent buying has been strong enough to improve the trend, rather than just produce a brief bounce.
The slope of SMA20 is rising at 1.09% over five days, which reinforces that the share is not merely drifting sideways. It is climbing with some discipline. The stock is also up 2.52% over five days and 3.69% over one month, so the short-term tape is aligned with the broader trend. That alignment matters more than any single day’s gain because it suggests persistent demand rather than one-off repositioning.
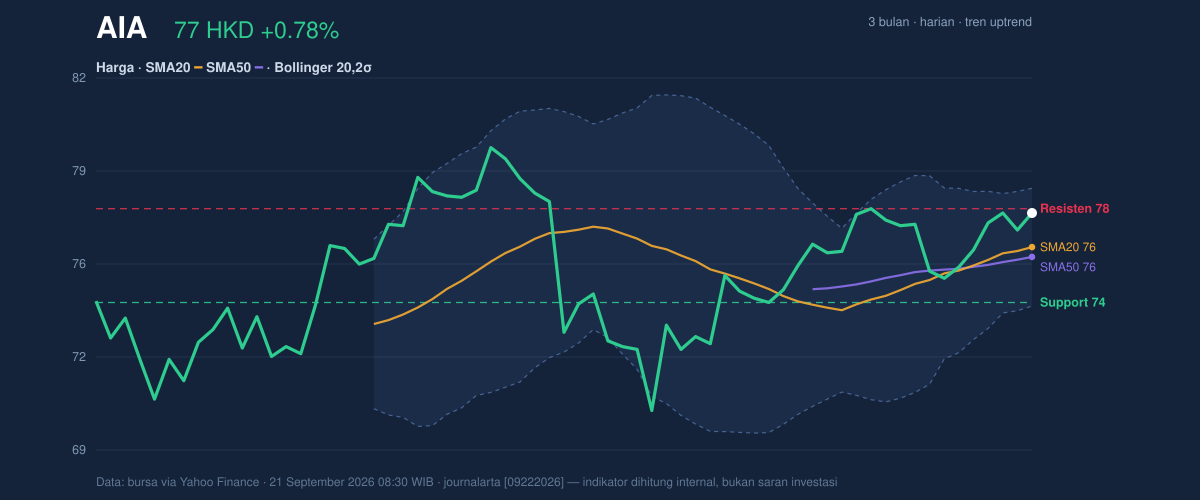
The key nuance is where the stock sits in its range. At HKD 77.35, it is trading at roughly 95% of the 20-hour range, close to resistance at HKD 77.50 and still below the 3-month high of HKD 80.15. That positioning says the market is pressing the top of the recent corridor, but it has not yet proved it can absorb supply above that level. If it does, the chart would likely shift from a steady uptrend to a more decisive expansion phase.
Oscillators & Momentum
Momentum is positive, but not overheated. The RSI(14) at 58.0 is best read as neutral-to-firm, which means the stock has room to extend without immediately looking stretched. RSI is often treated as a speed gauge: above 70 can imply a crowded move, while readings in the high 50s suggest strength without obvious excess.
The Stochastic %K at 73.9 and %D at 70.3 are also supportive, sitting in the upper half of the scale but not flashing a clear reversal warning. That tells traders the stock has been trending high within its recent range, though it is close enough to the upper zone that follow-through will matter. If the stochastic lines roll over while price stalls under resistance, the market could pause before any fresh advance.
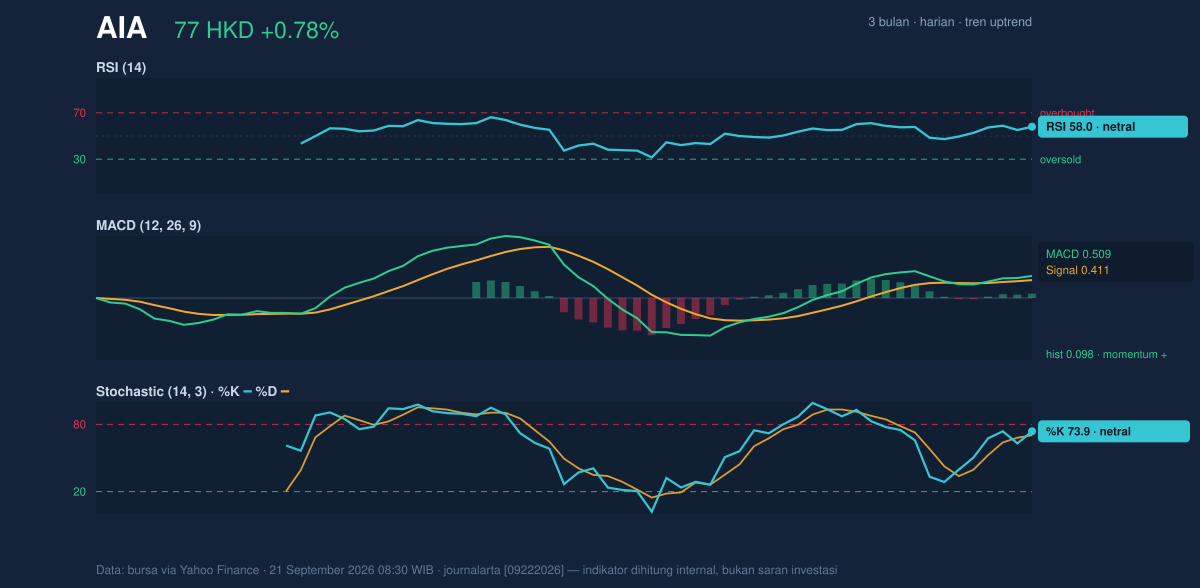
The strongest confirmation comes from MACD at 0.509 versus a signal line at 0.411, with a positive histogram of 0.098. MACD measures whether momentum is accelerating or fading; here, the positive spread shows the trend still has upward energy. The histogram being above zero is important because it says the current move is still being confirmed, not just defended.
Volatility & Volume
Volatility is moderate rather than explosive. ATR(14) at 1.59, or 2.1% of price, suggests the stock can move meaningfully in a session, but not in a disorderly way. That makes the current setup more about gradual continuation than abrupt whipsaws.
The Bollinger Bands add a useful signal. The upper band is at HKD 78.22, the middle band at HKD 76.15, and the lower band at HKD 74.08. With %B at 79%, the price is occupying the upper part of the band without yet pressing the extreme. More importantly, the band width is only 5.4% and is squeezing, which often means volatility has compressed and the next move could be sharper once price escapes the range. In simple terms, the market is coiling.
Volume gives the move credibility. Last volume was 26,364,410, slightly above the 20-hour average of 25,745,263, or about 1.0× normal. That is not a surge, but it is enough to show participation rather than a thin drift. OBV is rising, which means volume has been leaning in the same direction as price. That combination is constructive because advances backed by accumulating volume tend to be more durable than advances built on fading turnover.
Key Levels & Scenarios
The immediate battleground is clear. HKD 77.50 is the first resistance to watch, and HKD 74.20 is the nearest support. The stock is currently much closer to resistance than support, which means the next decisive move matters more than the last small gain.
If HKD 77.50 is cleared and held, the chart opens room toward the Bollinger upper band at HKD 78.22 and then the 3-month high at HKD 80.15. That would fit the current setup of a rising trend, positive MACD, and a narrowing Bollinger squeeze. If instead price fails to hold above the current band and slips back through HKD 76.15, the middle Bollinger line and SMA20 would become the first test of whether momentum is merely pausing or actually weakening.
Technical Verdict: HOLD (wait & see)
HOLD (wait & see) fits best because the trend is positive, but the stock is also pressing resistance with no confirmed breakout yet.
- MACD is positive, with the histogram above zero, so momentum still supports the uptrend.
- Price is above SMA20 and SMA50, and the golden cross confirms the short-term structure has improved.
- Bollinger Bands are squeezing, which can precede a stronger move, but the direction is not yet confirmed by a clean break above resistance.
Verdict invalidated if price falls below HKD 74.20, because that would break the nearest support and weaken the current bullish structure.
- Ideal Entry Range: HKD 76.15 to HKD 77.50
- Exit Target: HKD 78.22, then HKD 80.15
- Stop Loss protection: HKD 74.20
For non-traders, this means the stock is trending better, but it still needs to prove it can move through the next ceiling before the chart becomes more decisive.
Summary Data AIA
| Last price | 77.35 HKD |
| Change 1 day / 5 days / 1 month | 0.78% / 2.52% / 3.69% |
| Trend / MA-cross | uptrend / golden |
| SMA20 / SMA50 | 76.15 / 75.80 |
| RSI (14) / Stochastic %K | 58.0 / 73.9 |
| Bollinger %B / ATR | 79% / 1.59 |
| Support / Resistance 20 days | 74.20 / 77.50 |
| Data as of | 21 September 2026 08:30 WIB |



