Alibaba Stock Gains 3.02% Today, Momentum Gains
On September 22, 2026: price 112.60 HKD, trend sideways, RSI 52.1, support 105.10, resistance 116.60. technical analysis of alibaba stock.

Alibaba Group’s Hong Kong-listed shares rose to HK$112.60 in Tuesday trade, up 3.02% from the previous close of HK$109.30, as the stock pushed further into the upper half of its recent range without yet breaking through the next ceiling, according to exchange data. The move matters less for the headline gain than for the way it fits the chart: price is now above the 20-day average at HK$110.09 but still below the 50-day average at HK$115.46, a setup that usually signals a market trying to recover, but not yet fully repaired.
Trend & Price Action
The broader picture remains sideways, with the SMA20 slope down 3.17% over 5 days, which means the short-term trend is still leaning weaker even though today’s price sits above that line. In plain language, the stock is trying to climb out of a short-term soft patch, but the chart has not yet turned decisively bullish. That tension is visible in the moving averages: the price is above the faster average, while the slower SMA50 at HK$115.46 is still overhead, acting as a reminder that longer-term momentum has not been fully reclaimed. As shown in the chart, Alibaba is trading around 65% of the way through its 20-day range, which suggests the market is no longer near the floor, but also not close enough to the top to claim a breakout.
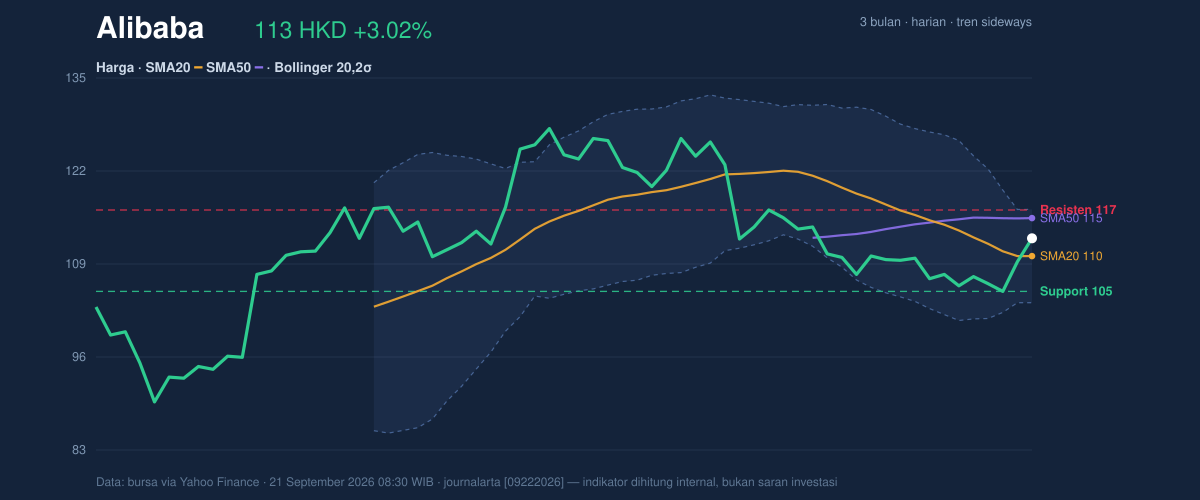
The key message from price structure is simple: the stock has improved, but it is still negotiating with resistance rather than escaping it.
Oscillators & Momentum
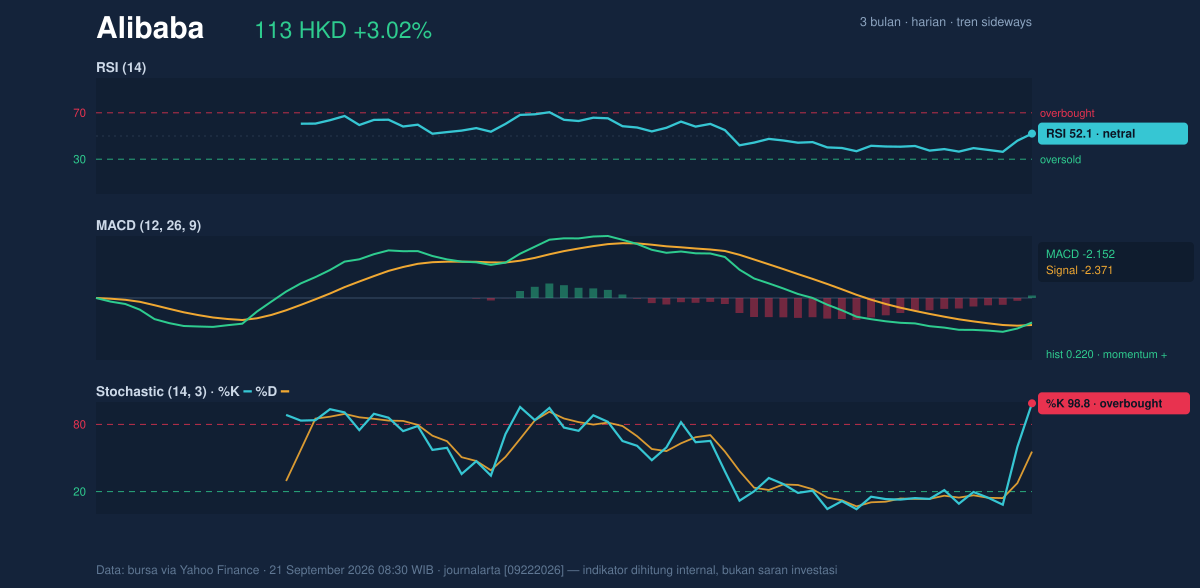
Momentum indicators are mixed, and that mix is what makes the current move interesting. The RSI at 52.1 is neutral, which means Alibaba is neither stretched to the upside nor washed out on the downside. That neutral reading matters because it leaves room for either direction, rather than warning that the move is already exhausted. By contrast, the Stochastic %K at 98.8 versus %D at 55.7 is firmly overbought, a sign that the latest push has been fast enough to leave the short-term oscillator ahead of itself. In practical terms, that often means the stock can keep rising for a while, but the pace may cool unless price follows through quickly.
The more constructive signal comes from MACD. The MACD at -2.152 remains below zero, so the stock is still technically under its longer trend baseline, but the histogram at 0.220 and the MACD line being above the signal line at -2.371 show positive momentum is building. This is a classic “improving but not confirmed” pattern: the stock is gaining internal strength before the trend line fully flips.
That is a better sign than it looks at first glance.
Volatility & Volume
Volatility is neither compressed enough to hint at an imminent squeeze nor wide enough to suggest panic. The Bollinger Band width at 12.0% is normal, and price sits at %B 69%, meaning Alibaba is trading in the upper part of the band but not at the extreme top. The upper band at HK$116.69 is close enough to matter: it is the first technical barrier that can cap the current rebound, especially since the stock is still below the 50-day average at HK$115.46. If price can move through that zone, the chart would start to look less like a bounce and more like a trend repair.
Volume, however, is not confirming the move strongly. Last turnover of 54,733,772 shares was only 0.8x the 20-day average of 71,265,443, so the latest rise happened on lighter participation than usual. That does not invalidate the advance, but it does mean the move lacks the kind of broad market commitment that often accompanies a decisive breakout. The one encouraging counterweight is that OBV is rising, which suggests accumulation is still edging ahead of distribution even if today’s trading was not especially heavy.
Key Levels & Scenarios
The chart’s most important nearby markers are clear. Support at HK$105.10 is the first level that needs to hold if the rebound is to remain intact. Below that, the market would be vulnerable to a retest of the lower Bollinger band at HK$103.50. On the upside, resistance at HK$116.60 is the immediate barrier, closely aligned with the upper Bollinger band at HK$116.69. That overlap matters because when resistance and band resistance sit almost on top of each other, the level becomes more meaningful: it is where short-term traders often test conviction.
The stock’s 3-month high at HK$130.30 and 3-month low at HK$88.65 frame the broader range. Alibaba is well above the lower end, which shows the recovery from weakness is real, but it remains far from the upper boundary, which keeps the longer-range ceiling in view.
If price clears HK$116.60 with improving participation, the next technical test is the upper band at HK$116.69 and then the broader move toward the prior range top. If it fails there, the stock is likely to stay range-bound between support and resistance.
Technical Verdict: HOLD (wait & see)
HOLD (wait & see) reflects the current mix of signals: improving momentum, but no clean trend confirmation yet.
- Reason 1: MACD is improving and the histogram is positive, showing momentum is turning more constructive.
- Reason 2: Price is above SMA20, which supports the rebound, but still below SMA50, so the longer trend has not been reclaimed.
- Reason 3: Stochastic is overbought while volume is only 0.8x average, which argues for caution near resistance.
- Invalidation: this verdict is invalidated if price falls below HK$105.10, because that would break the nearest support and weaken the rebound structure.
- Ideal Entry Range: HK$105.10 to HK$110.09
- Exit Target: HK$116.60 to HK$116.69
- Stop Loss protection: below HK$103.50
In plain English: the chart says Alibaba is recovering, but it has not yet proven that the recovery is strong enough to call a clean trend change.
Alibaba’s last price was HK$112.60.
Summary Data Alibaba
| Last price | 112.60 HKD |
| Change 1 day / 5 days / 1 month | 3.02% / 6.33% / 0.09% |
| Trend / MA-cross | sideways / none |
| SMA20 / SMA50 | 110.09 / 115.46 |
| RSI (14) / Stochastic %K | 52.1 / 98.8 |
| Bollinger %B / ATR | 69% / 3.21 |
| Support / Resistance 20 days | 105.10 / 116.60 |
| Data as of | 21 September 2026 08:30 WIB |



