HSBC Stock Analysis: Drops 0.23%, Momentum Weakens
On September 22, 2026: price 1,533.80 GBp, trend sideways, RSI 45.6, support 1,503.80, resistance 1,580.20. technical analysis of hsbc stock.

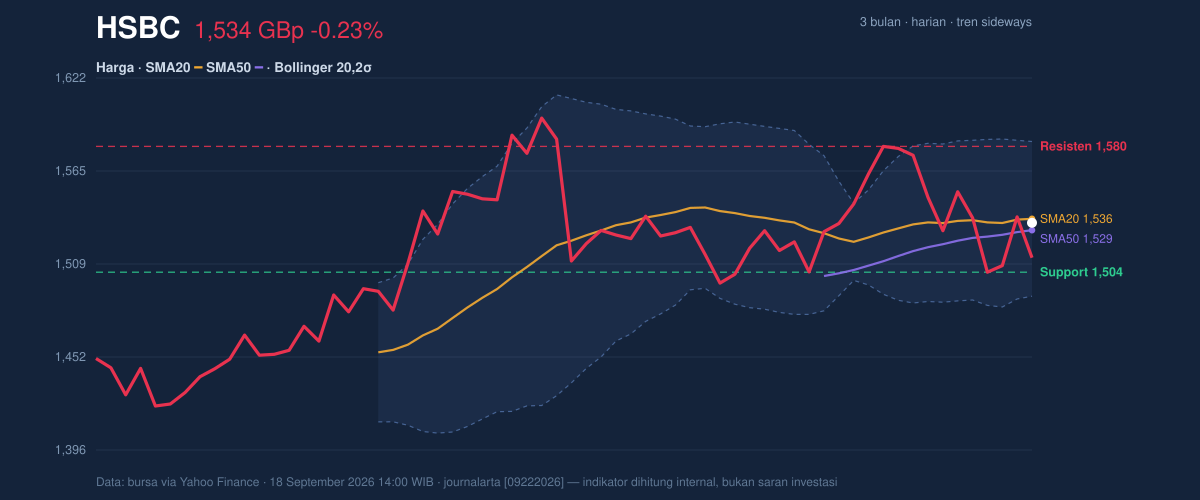
1,533.80 GBp is where HSBC Holdings ended the latest session on the London market, a modest -0.23% daily slip that leaves the shares sitting just below their short-term average and inside a tightening trading band, according to exchange data tracked via Yahoo Finance. The message from the chart is not dramatic, but it is not neutral either: price is still holding above the longer SMA50 at 1,529.30, while the nearer SMA20 at 1,536.22 is acting as a small ceiling. That mix usually points to a market that is waiting for a catalyst rather than committing to a direction.
Trend & Price Action
The broader structure remains sideways, and the slope of the SMA20 at 0.08% over 5 days suggests the recent drift is almost flat rather than trending decisively. That matters because sideways setups often compress energy before a move, especially when price is hovering close to the middle of its range. HSBC’s last close sits just under the short-term average, which tells traders that buyers have not yet reclaimed the immediate trend line, but sellers have also failed to push the stock decisively away from it. In plain terms, the shares are in a holding pattern, not a breakdown.
The stock is trading above its SMA50, which is a mild sign that the medium-term base remains intact. There is no fresh MA-cross, so there is no new moving-average signal to suggest a trend reversal has already started. As shown in the chart, the price is also positioned around 39% of the 20-hour range, which places it closer to support than resistance, but not near the lower edge where panic usually appears. The three-month range of 1,350.00 to 1,610.00 shows the shares are still mid-range, with room on either side if a breakout or breakdown develops.
Oscillators & Momentum
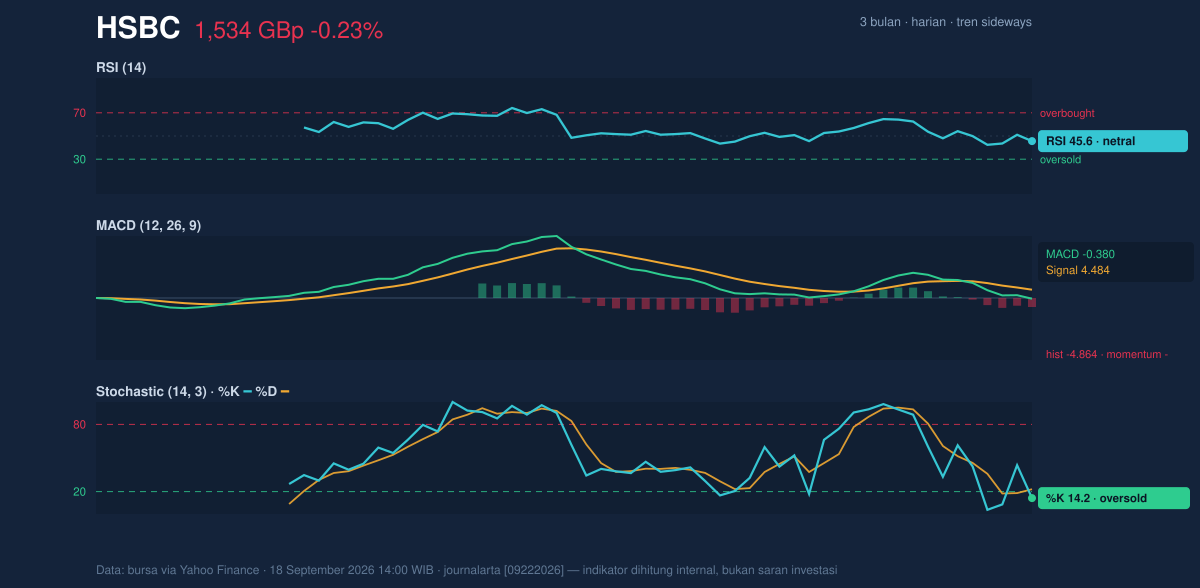
The momentum picture is more cautious than the price action alone might suggest. The RSI at 45.6 is neutral, which means HSBC is neither stretched on the upside nor oversold on a broad basis. That reading often fits a market that is waiting for confirmation. By contrast, the Stochastic %K at 14.2 and %D at 22.1 is in oversold territory, implying short-term selling pressure has already run ahead of itself. In practical terms, this does not guarantee a rebound, but it does tell readers that the latest dip has started to look tired on a very short horizon.
The more important signal is the MACD at -0.380, with a signal line at 4.484 and a histogram at -4.864. That combination is plainly negative: the MACD line is below its signal line, and the widening negative histogram shows downside momentum is still dominating. This is the key reason the stock cannot be described as technically strong yet, even though some short-term oscillators are already leaning oversold. The chart shows a split message: the faster tools are hinting at exhaustion, while the trend-following tool is still pointing down.
Volatility & Volume
Volatility is not elevated in a panic sense, but it is not asleep either. The ATR(14) at 30.99, equal to about 2.0% of price, suggests a normal-to-moderate daily swing for HSBC. More interesting is the Bollinger setup: the bands are relatively tight, with the upper band at 1,583.20, the middle at 1,536.22, and the lower band at 1,489.24. A 6.1% band width indicates a squeeze, meaning the market has compressed enough that a larger move becomes more likely. The %B at 47% shows price is sitting near the middle of the band structure, not pressing either extreme. That is classic pre-breakout behavior, but direction is not yet confirmed.
Volume adds an important caution. The latest print of 51,220,387 shares was 2.6 times the 20-session average of 20,032,461, so participation was clearly heavier than normal. However, OBV is falling, which means the heavier trading has not translated into sustained accumulation. In other words, the market is active, but the volume trail says that activity has recently been more consistent with distribution than with steady buying. That weakens the case for reading the volume spike as a clean bullish confirmation.
Key Levels & Scenarios
The nearest support at 1,503.80 is the first level to watch if the stock continues to drift lower. A hold above that area would keep the sideways structure intact and preserve the possibility of a rebound toward the upper band. On the upside, resistance at 1,580.20 lines up closely with the Bollinger upper band at 1,583.20, making that zone the first real test of whether the squeeze resolves higher. If price can reclaim the SMA20 at 1,536.22 and then push through 1,580.20, it would show that the market has absorbed recent selling pressure and is ready to probe the top of the range.
If, however, the shares fail to hold 1,503.80, the chart would begin to lean toward the lower side of the 1,489.24 Bollinger floor and potentially toward the broader 1,350.00 to 1,610.00 range low. The key point is that the setup is compressed, not resolved. That is why the next move matters more than the current one.
Technical Verdict: HOLD (wait & see)
- MACD is negative, with the histogram at -4.864, so trend momentum still leans down.
- Stochastic is oversold at 14.2 / 22.1, which hints at short-term exhaustion but not a confirmed reversal.
- Bollinger bands are squeezing with 6.1% width, so the stock is compressed and waiting for direction.
Verdict invalidated if price breaks below 1,503.80, because that would weaken the current range floor and increase the risk of a move toward the lower band.
- Ideal Entry Range: 1,503.80 to 1,536.22
- Exit Target (Target Price): 1,580.20 to 1,583.20
- Stop Loss protection: below 1,489.24
For non-traders, this means HSBC is sitting in a compressed range where the next decisive move matters more than the last small dip.
18 September 2026 14:00 WIB: volume was 51,220,387 shares versus a 20-session average of 20,032,461.
Summary Data HSBC
| Last price | 1,533.80 GBp |
| Change 1 day / 5 days / 1 month | -0.23% / -1.21% / 2.08% |
| Trend / MA-cross | sideways / none |
| SMA20 / SMA50 | 1,536.22 / 1,529.30 |
| RSI (14) / Stochastic %K | 45.6 / 14.2 |
| Bollinger %B / ATR | 47% / 30.99 |
| Support / Resistance 20 days | 1,503.80 / 1,580.20 |
| Data as of | 18 September 2026 14:00 WIB |



