AstraZeneca Stock Analysis: Gains 1.06%, Testing Key Resistance
On September 22, 2026: price 12,560.00 GBp, trend sideways, RSI 59.5, support 11,650.00, resistance 12,500.00. technical analysis of astrazeneca stock.

Shares in AstraZeneca (AZN.L) were last quoted at 12,560.00 GBp on the London Stock Exchange at 14:00 WIB on 18 September 2026, up 1.06% on the day and extending a 7.28% gain over five days. The move matters less for its size than for where it happened: the stock is now trading above the 20-day and 50-day moving averages, while volume has surged to 2.1× the 20-session average. That combination usually signals that buyers are not just testing the tape; they are defending it with conviction, even if the broader trend still reads as sideways.
Trend & Price Action
As shown in the chart, AstraZeneca is still technically in a sideways trend, but the short-term tone has improved. The SMA20 at 12,080.10 is rising at 0.99% over five days, which suggests the recent bounce has enough follow-through to lift the near-term average rather than merely spike above it. The stock also sits above the SMA50 at 12,193.48, so the price structure is leaning firmer than it was earlier in the month. There is no fresh moving-average crossover, which means this is not yet a clean trend-change signal; it is better read as a recovery inside a range.
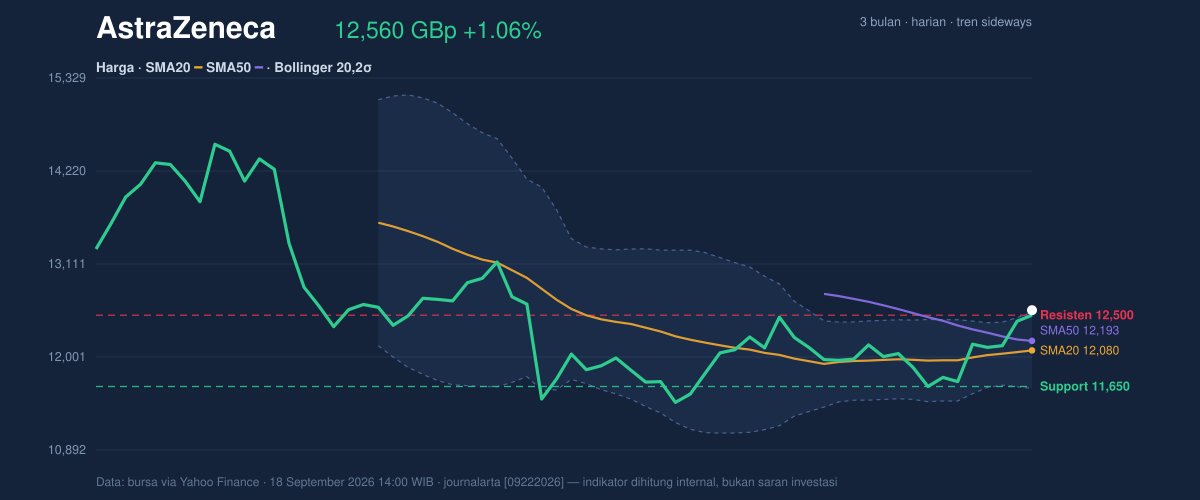
The Bollinger bands add an important layer. The upper band is at 12,534.48, and the last price is already nudging above it with %B at 103%. In plain English, that means the shares are trading beyond the usual upper boundary of the recent range. That can mark strength, but it also warns that the move is stretched in the short term. The band width is only 7.5%, described in the data as a squeeze, which often precedes a sharper directional move. In other words, the stock is pressing against resistance while volatility is compressed; that is a setup for expansion, not a guarantee of direction.
Oscillators & Momentum
The momentum picture is mixed, and that mix is the key signal. The RSI at 59.5 is still neutral, so the stock is not yet in the kind of overheated condition that typically warns of a broader reversal. But the Stochastic oscillator at 90.8 / 89.8 is clearly overbought, which means the latest upswing has moved quickly and may be vulnerable to a pause or pullback. That divergence matters because stochastic tends to react faster than RSI; it is telling us the immediate move is extended even if the bigger momentum gauge has not fully confirmed exhaustion.
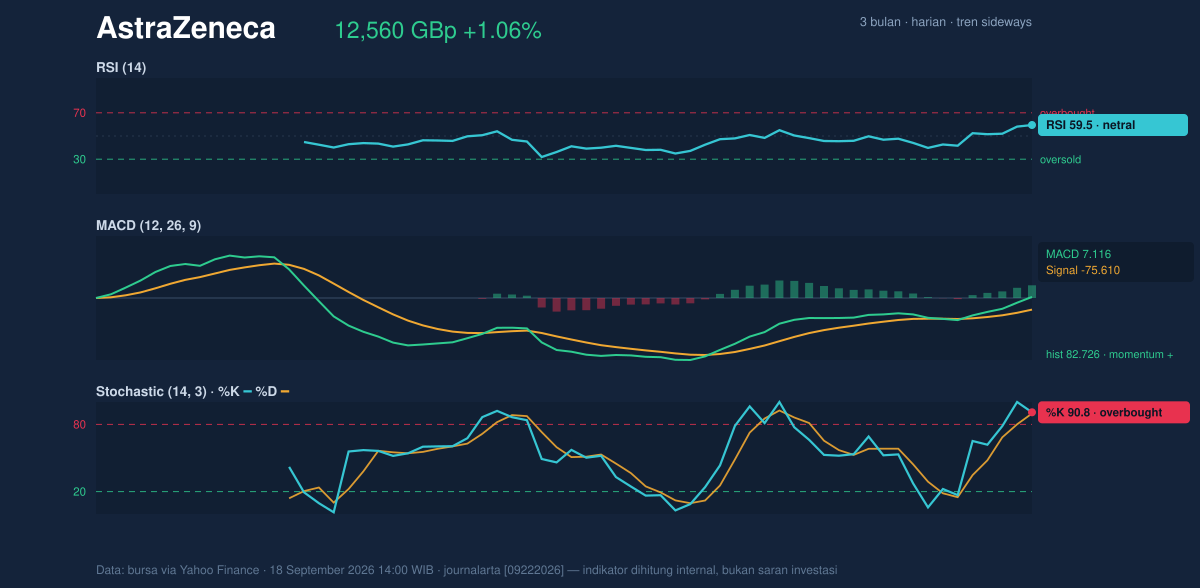
MACD is the strongest bullish element in the set. With MACD at 7.116, a signal line at -75.610 and a histogram of 82.726, the momentum spread is decisively positive. That reading implies the short-term trend has accelerated sharply relative to the medium-term baseline. For readers unfamiliar with the term, the histogram measures the gap between MACD and its signal line; a wide positive gap usually means upward momentum is still building. The caution is that such a strong impulse can also become self-limiting if price fails to hold above nearby resistance.
Volatility & Volume
Volatility is moderate rather than extreme. The ATR(14) at 310.99, equal to 2.5% of price, suggests the stock can still move meaningfully in a session, but not in a disorderly way. That matters because the current price is already near the top of the recent range, where a moderate ATR can still produce a test of support if momentum cools. The volume pattern, however, argues that the latest push is backed by participation rather than thin trading. Last volume at 6,543,165 against a 20-session average of 3,104,648 is a clear expansion, and OBV is rising, which indicates that volume has been accumulating on the side of the advance rather than fading underneath it.
Key Levels & Scenarios
The nearest reference points are well defined. The stock is trading above the 20-hour support at 11,650.00 and just over the 20-hour resistance at 12,500.00. Because the last price is at 107% of the intraday range, the market is already leaning into the resistance zone rather than sitting in the middle of it. That positioning makes the next few sessions important: if price can hold above 12,500.00, the squeeze in Bollinger bands raises the chance of a continuation move. If it slips back below that level, the move starts to look more like a failed breakout and a return toward the moving-average area.
The broader 3-month range gives context. The shares have traded between 14,686.00 and 9,892.00, so the current level is neither at the extreme top nor bottom of that window. Yet the fact that price has climbed back above both moving averages while volume expands suggests the market is probing the upper half of the range with more confidence than before. The question is whether that confidence can survive the overbought stochastic reading.
Technical Verdict: HOLD (wait & see)
HOLD (wait & see)
- Reason 1: MACD is strongly positive, showing momentum is still in the buyers’ favor.
- Reason 2: Price is above SMA20 and SMA50, which supports the short-term recovery structure.
- Reason 3: Stochastic is overbought and price is already above the Bollinger upper band, so the move is extended.
Verdict invalidated if price breaks below 11,650.00, because that would undercut the stated support and weaken the current breakout attempt.
- Ideal Entry Range: 12,080.10 to 12,500.00
- Exit Target: 12,534.48 and then 12,560.00
- Stop Loss protection: 11,650.00
In plain English, the chart says AstraZeneca is improving, but it is also stretched enough that confirmation matters more than chasing the move.
Last price: 12,560.00 GBp.
Summary Data AstraZeneca
| Last price | 12,560.00 GBp |
| Change 1 day / 5 days / 1 month | 1.06% / 7.28% / 3.90% |
| Trend / MA-cross | sideways / none |
| SMA20 / SMA50 | 12,080.10 / 12,193.48 |
| RSI (14) / Stochastic %K | 59.5 / 90.8 |
| Bollinger %B / ATR | 103% / 310.99 |
| Support / Resistance 20 days | 11,650.00 / 12,500.00 |
| Data as of | 18 September 2026 14:00 WIB |



