On October 6, 2026: price 560.90 GBp, trend uptrend, RSI 54.7, support 542.30, resistance 580.30. technical analysis of bp stock. BP Stock Drops — full details…
By matthew jonathan
October 7, 20264 min read
BP Stock Drops 0.41%, Momentum Weakens In Focus
BP’s shares closed at 560.90 GBp on the London Stock Exchange on 6 October, down 0.41% on the day but up 1.85% over five days and 1.96% over one month. The mixed signals matter: the broader price structure is rising, yet short-term momentum has weakened and trading volume was exceptionally thin.
Trend & Price Action
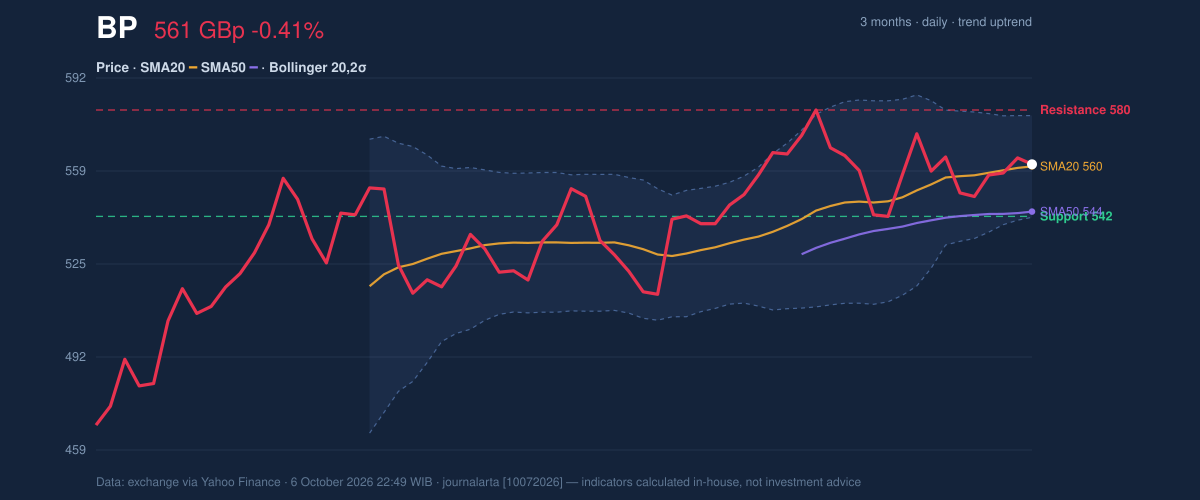
BP remains above its 20-day moving average, or SMA20, at 560.15 GBp and its 50-day average at 544.04 GBp. The SMA20 is sloping upward, rising 0.63% over five trading days, which supports the current uptrend. But there has been no recent moving-average crossover—a signal that one average has moved through another—so the data do not show a fresh acceleration in the trend.
The price is close to the SMA20 and near the middle of its recent range: it sits at 49% of the span between 20-day support at 542.30 GBp and resistance at 580.30 GBp. That leaves neither buyers nor sellers with a clear near-term advantage. The three-month high is 582.60 GBp; the supplied low is 0.00 GBp, which is not a useful reference for judging the trading range.
As shown in the chart, the price is hovering around the rising short-term average, while the plotted bands and levels frame a relatively narrow area for the next move.
3-month price action chart of BP: price, SMA20/50, Bollinger, support & resistance. Data: exchange via Yahoo Finance.
Oscillators & Momentum
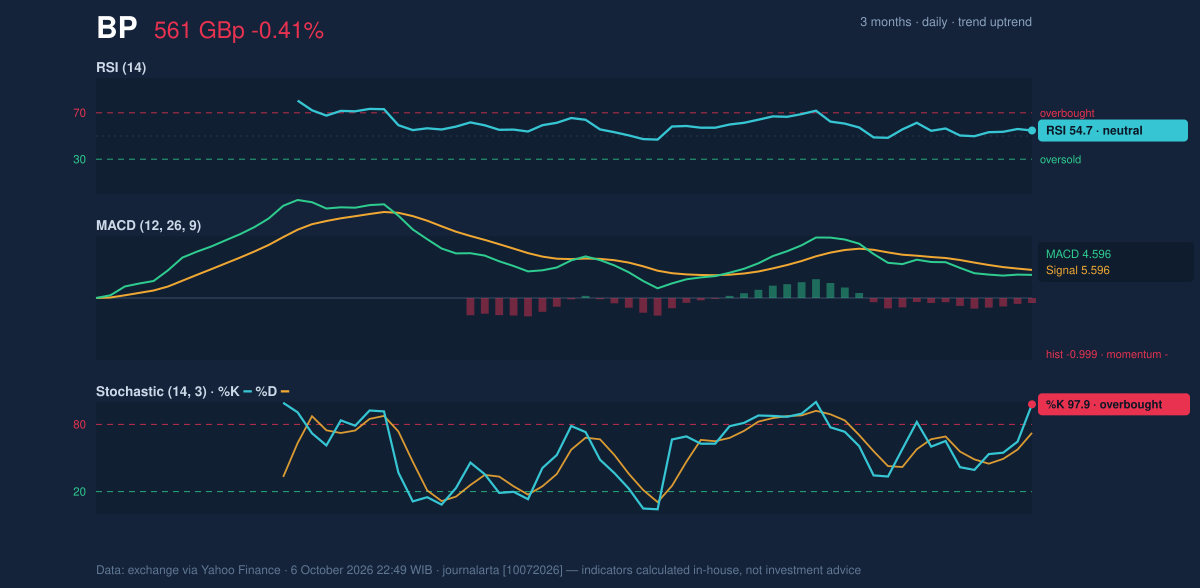
The momentum indicators are pulling in different directions. RSI is neutral at 54.7; the Relative Strength Index gauges the pace of recent gains and losses, and this reading does not indicate an extreme. By contrast, Stochastic %K at 97.9 and %D at 72.4 is overbought, meaning the price has risen quickly relative to its recent range and could be vulnerable to a pause or pullback.
The MACD reinforces that caution. Its reading is 4.596, below the 5.596 signal line, with a negative histogram of -0.999. MACD compares shorter- and longer-term price momentum; this configuration suggests upward momentum has weakened, even though the broader trend remains positive. It is a warning, not by itself proof that the trend has reversed.
The chart helps make that split visible: neutral RSI sits alongside an elevated Stochastic reading and a MACD histogram below zero.
Momentum chart of BP: RSI(14), MACD, Stochastic. Data: exchange via Yahoo Finance.
Volatility & Volume
Bollinger Bands—the range around a moving average that expands and contracts with price volatility—are narrowing. The band width is 6.5%, with price at 52% of the distance from the lower band at 542.01 GBp to the upper band at 578.30 GBp. This squeeze can precede a larger move, but it does not indicate which direction that move will take. The price’s position near the middle band, 560.15 GBp, offers no strong directional confirmation.
Reported ATR is 54.00 GBp, or 9.6% of the share price, indicating high volatility in the supplied data. That measure estimates the typical size of price movement, not its direction. Volume adds another reason for restraint: the latest reading of 38,126 was negligible against the 20-day average of 46,025,509, while OBV, a cumulative measure of volume flow, was falling. The move therefore lacks evidence of broad participation in the latest session.
Key Levels & Scenarios
The immediate technical boundaries are 542.30 GBp support and 580.30 GBp resistance. A break above resistance would put the three-month high of 582.60 GBp into focus as the next supplied reference. Failure to hold support would weaken the near-term rising structure and shift attention to the lower Bollinger Band at 542.01 GBp. These are conditional scenarios, not forecasts.
The core signal is an intact but unconfirmed uptrend: rising moving averages are offset by weakening MACD, overbought Stochastic and very thin volume.
Technical Verdict: HOLD (wait & see)
The indicators support a neutral stance because the price remains above both moving averages, but momentum and volume have not confirmed further strength.
Ideal Entry Range: 542.30–560.15 GBp, between 20-day support and the SMA20, if price holds that area.
Exit Target (Target Price): 578.30–580.30 GBp, around the upper Bollinger Band and 20-day resistance.
Stop Loss protection: 542.01 GBp, below the lower Bollinger Band; the verdict is invalidated if price falls below 542.30 GBp support.
In plain English, the trend is still pointed upward, but the evidence is not strong enough to confirm that momentum will carry it higher.
Data source: exchange data via Yahoo Finance, as of 6 October 2026 at 22:49 WIB.