HSBC Stock Technicals: Gains 0.90% on Tuesday, Momentum Weakens
On October 6, 2026: price 1,472.20 GBp, trend downtrend, RSI 42.5, support 1,437.00, resistance 1,552.60. technical analysis of hsbc stock.
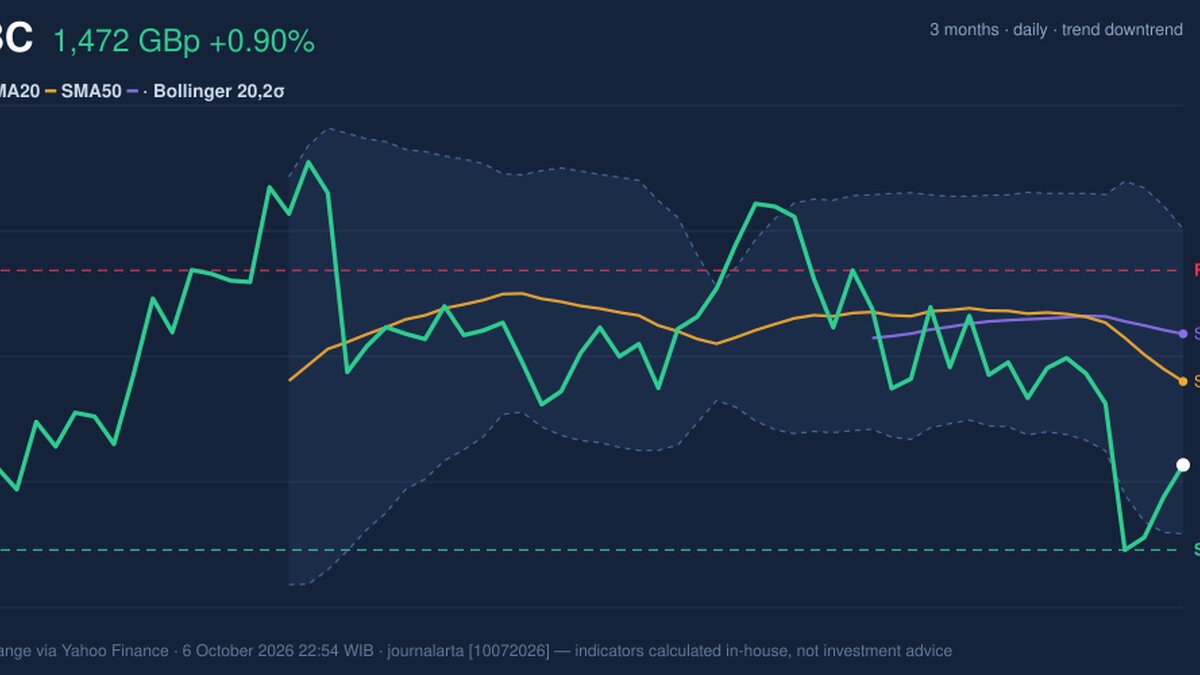
HSBC shares rose 0.90% to 1,472.20 GBp on 6 October, but remain in a downtrend: the stock is below both its 20-day and 50-day moving averages, and is down 6.52% over one month. The daily gain has not yet overturned the broader weakness. The latest figures are from exchange data via Yahoo Finance, as of 22:54 WIB.
Trend & Price Action
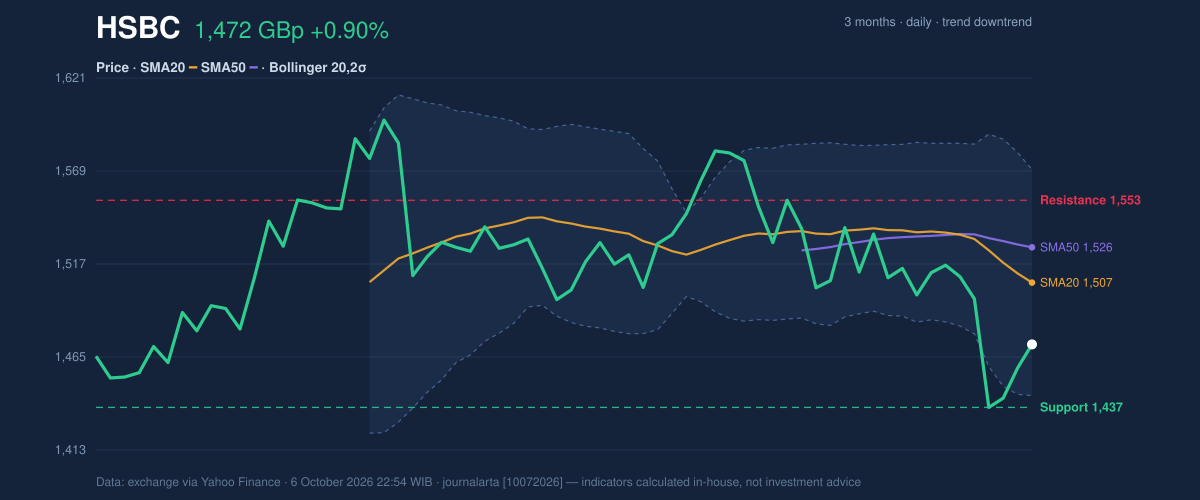
HSBC’s share price sits below its SMA20 of 1,506.67 and SMA50 of 1,526.36. The shorter average is also falling, down 1.74% over five trading days. That combination points to persistent near-term pressure rather than a confirmed change in direction. No new moving-average crossover has formed.
The price is in the lower part of its recent trading range: at about 30% of the distance from 20-day support at 1,437.00 to resistance at 1,552.60. Its position suggests sellers still have the advantage, even after the latest rise. The three-month low is reported as 0.00, which does not provide a useful reference for judging the recent price structure.
The key near-term test is whether HSBC can reclaim its falling 20-day average.
Oscillators & Momentum
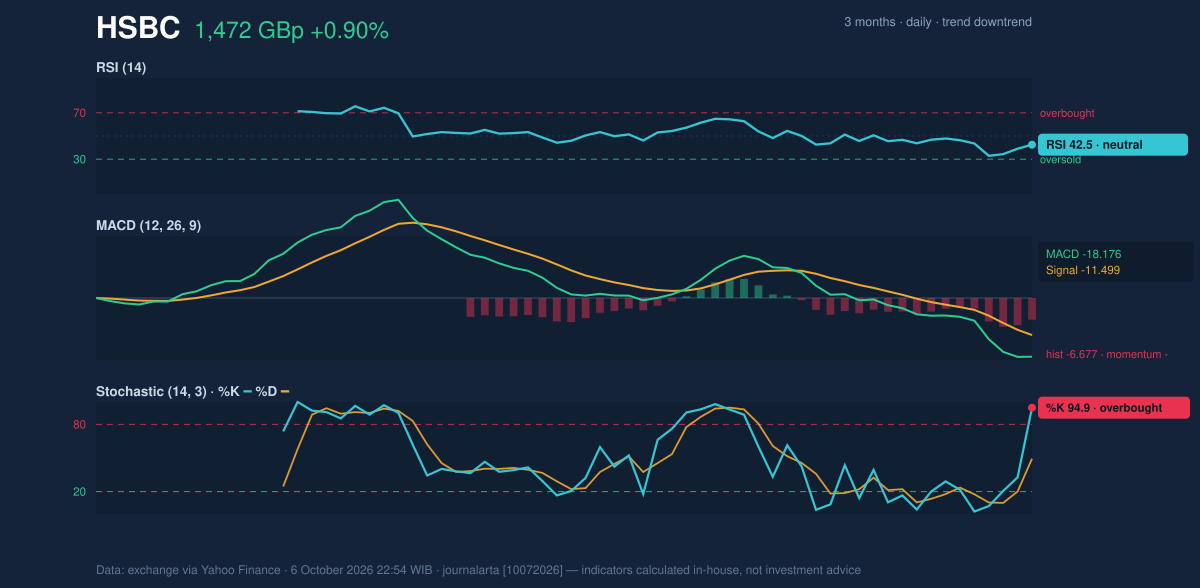
Momentum indicators are mixed, but the balance remains weak. The RSI is 42.5, a neutral reading that indicates neither extreme oversold conditions nor strong upward momentum. The MACD is below its signal line, with a negative histogram, confirming that downward momentum remains in place.
The Stochastic reading is less supportive of the daily rise: %K at 94.9 is overbought relative to %D at 49.4. In plain terms, the short-term rebound has moved quickly, but the broader momentum indicators do not yet confirm a durable recovery. That divergence raises the risk that gains may stall near resistance.
Volatility & Volume
The share price is near the lower Bollinger Band, with %B at 23% and the band width at 8.4%, a normal rather than unusually compressed range. The lower band at 1,443.65 sits close to the 20-day support level, creating a nearby zone where the price may encounter buying interest — though neither level guarantees a floor.
Volatility is elevated: ATR is 134.59, or 9.1% of the share price. ATR measures the typical size of price swings, not their direction. With moves of that scale, support or resistance tests may be sharp.
Trading volume was 7,623,745 shares, around 0.4 times the 20-day average of 19,438,029 — thin participation. OBV, a cumulative measure that relates volume to price direction, is rising. That is a tentative sign of underlying accumulation, but low turnover limits how strongly it can challenge the downtrend.
Key Levels & Scenarios
Support is 1,437.00, close to the Bollinger lower band at 1,443.65. A break below that support would weaken the case for stabilisation and expose the shares to further downside, although the supplied data do not establish a lower target. If support holds, a rebound would first need to contend with the SMA20 at 1,506.67, followed by resistance at 1,552.60. A move above resistance would improve the technical picture, but the declining averages and negative MACD remain obstacles.
Technical Verdict: HOLD (wait & see)
The indicators support a cautious, non-directional verdict rather than a confirmed trend reversal:
- Reasons: price remains below the SMA20 and SMA50; MACD momentum is negative; and the Stochastic is overbought despite a neutral RSI.
- Invalidation: this verdict is invalidated if price falls below 1,437.00, the stated 20-day support.
- Indicative entry range: 1,437.00–1,443.65, using support and the lower Bollinger Band as reference levels.
- Indicative exit target: 1,552.60, the stated 20-day resistance.
- Stop-loss reference: below 1,437.00; a break would mean support had failed.
For non-traders, the chart signals are mixed, so the next clear clue is whether the shares hold support or recover resistance.
Data
Market data: exchange via Yahoo Finance, as of 6 October 2026, 22:54 WIB. Last price: 1,472.20 GBp; previous close: 1,459.00 GBp. One-day change: +0.90%; five-day change: −2.50%; one-month change: −6.52%. SMA20: 1,506.67; SMA50: 1,526.36. Bollinger Bands: upper 1,569.69; middle 1,506.67; lower 1,443.65. RSI(14): 42.5. Stochastic: %K 94.9, %D 49.4. MACD: −18.176; signal: −11.499; histogram: −6.677. ATR(14): 134.59. Volume: 7,623,745; 20-day average: 19,438,029. OBV: rising. Support: 1,437.00; resistance: 1,552.60.
Summary Data HSBC
| Last price | 1,472.20 GBp |
| Change 1 day / 5 days / 1 month | 0.90% / -2.50% / -6.52% |
| Trend / MA-cross | downtrend / none |
| SMA20 / SMA50 | 1,506.67 / 1,526.36 |
| RSI (14) / Stochastic %K | 42.5 / 94.9 |
| Bollinger %B / ATR | 23% / 134.59 |
| Support / Resistance 20 days | 1,437.00 / 1,552.60 |
| Data as of | 6 October 2026 22:54 WIB |
Track HSBC share price daily: live levels, support/resistance and our full HSBC analysis history.