AstraZeneca Stock Technicals: Gains 1.65% on Tuesday, Momentum Weakens
On October 6, 2026: price 11,958.00 GBp, trend sideways, RSI 43.6, support 11,650.00, resistance 12,672.00. technical analysis of astrazeneca stock.

AstraZeneca shares rose 1.65% to 11,958.00 GBp on 6 October, according to market data from the exchange via Yahoo Finance, but remain below both their 20-day and 50-day moving averages. The daily rebound contrasts with a 3.78% decline over five trading days and negative MACD momentum, leaving the short-term picture mixed rather than clearly improved.
Trend & Price Action
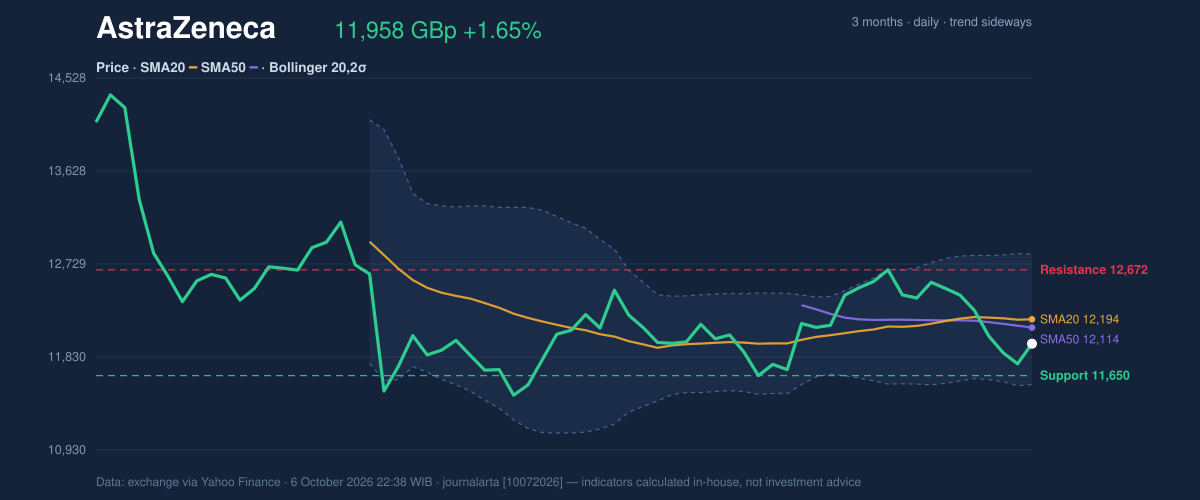
At the latest close, the shares sat below the SMA20 at 12,194.40 GBp and the SMA50 at 12,113.92 GBp. A simple moving average tracks the average closing price over a set period; trading below both suggests that recent prices have not yet reclaimed their short-term trend markers. The 20-day average is also edging down, by 0.06% over five days. There has been no fresh moving-average crossover to signal a change in trend.
The broader pattern is sideways, with a modest 0.69% gain over one month. At 30% of the 20-trading-day range, the shares are closer to the stated support than resistance. The supplied three-month low is 0.00 GBp, which does not provide a usable reference for interpreting the price range.
As shown in the price chart, the Bollinger middle line coincides with the SMA20, while the upper and lower bands mark a wide range around it. The 31% Bollinger %B reading places the price in the lower portion of that band, consistent with a share price below its recent average—not, on its own, proof that a rebound is due.
Oscillators & Momentum
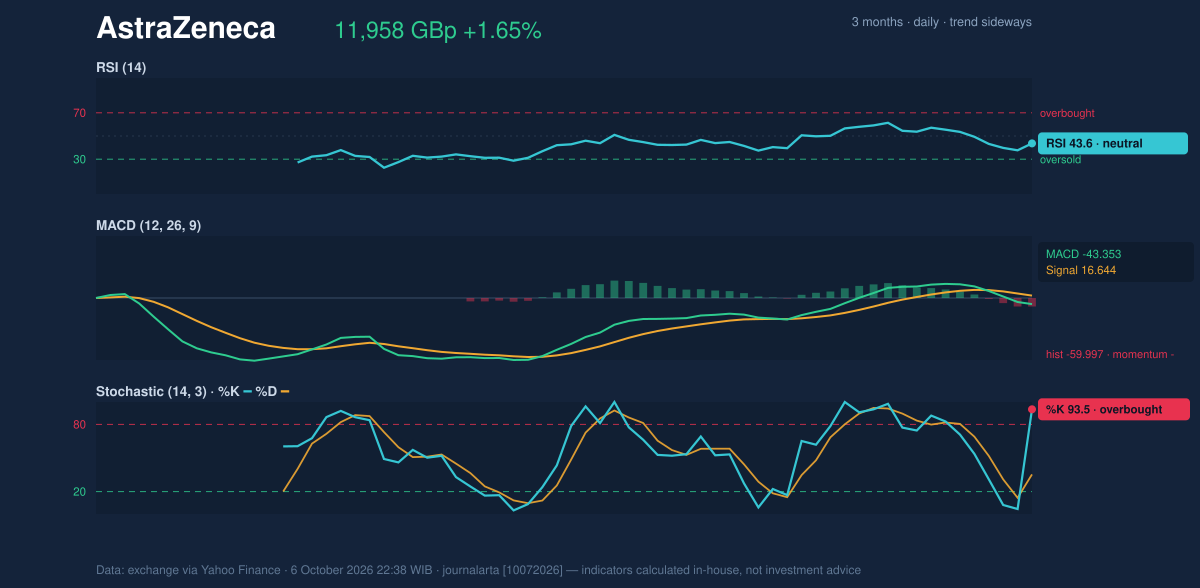
Momentum indicators do not yet confirm the one-day rise. The RSI is 43.6, a neutral reading, indicating neither an especially strong upward push nor an oversold condition. The Stochastic readings are sharply divided: %K at 93.5 is overbought, while %D is 35.3. Stochastic compares a recent close with its trading range; such a high %K can indicate that prices have risen quickly within that range, but the gap with %D makes the signal less conclusive.
The MACD is more clearly negative. Its reading of -43.353 is below the signal line at 16.644, and the -59.997 histogram shows the gap between them remains negative. In plain terms, this indicator points to downward momentum despite the latest session’s gain. The chart helps show the contrast between that negative MACD setup and the elevated Stochastic reading.
Volatility & Volume
The Bollinger band width is 10.4%, classified as normal rather than unusually compressed or expanded. That gives no clear squeeze signal—when bands narrow, traders often watch for a larger move as volatility returns. However, the ATR is 1,090.24 GBp, or 9.1% of the share price, indicating high measured price volatility. ATR estimates the typical trading range; it does not predict direction.
Participation data offers little confirmation for the session’s advance. Reported volume was 6,077 against a 20-day average of 3,037,268, a gap so large that the latest reading is labelled thin. OBV, which accumulates volume according to whether prices rise or fall, is also declining. Together, those measures weaken the case that the daily gain reflects broad buying pressure.
Key Levels & Scenarios
The stated 20-day support is 11,650.00 GBp, while resistance is 12,672.00 GBp. A sustained move above resistance would place the share price beyond the upper end of its recent range; failure to hold support would instead mark a break below that range’s lower reference. Between those levels, the moving averages around 12,114–12,194 GBp are nearer-term hurdles, not confirmed breakouts.
Technical Verdict: HOLD
The technical reading is HOLD (wait & see), reflecting conflicting signals rather than a firm directional setup. The shares remain below both moving averages, MACD is negative, and declining OBV does not confirm the latest rise; against that, RSI is neutral and price remains above stated support. The verdict is invalidated if the price falls below 11,650.00 GBp.
- Indicative entry range: 11,650.00–12,194.40 GBp, bounded by stated support and the SMA20.
- Indicative exit target: 12,672.00 GBp, the stated 20-day resistance.
- Indicative stop-loss protection: below 11,650.00 GBp, using support as the level that would invalidate the range-based view.
For non-traders, the signals are mixed, so the chart has not yet established a clear direction.
Summary Data AstraZeneca
| Last price | 11,958.00 GBp |
| Change 1 day / 5 days / 1 month | 1.65% / -3.78% / 0.69% |
| Trend / MA-cross | sideways / none |
| SMA20 / SMA50 | 12,194.40 / 12,113.92 |
| RSI (14) / Stochastic %K | 43.6 / 93.5 |
| Bollinger %B / ATR | 31% / 1,090.24 |
| Support / Resistance 20 days | 11,650.00 / 12,672.00 |
| Data as of | 6 October 2026 22:38 WIB |
Track AstraZeneca share price daily: live levels, support/resistance and our full AstraZeneca analysis history.