Singtel Stock Drops 0.47% on Tuesday, Testing Support Level
On October 6, 2026: price 4.25 SGD, trend downtrend, RSI 35.5, support 4.25, resistance 4.56. technical analysis of singtel stock. Singtel Stock Drops — full…
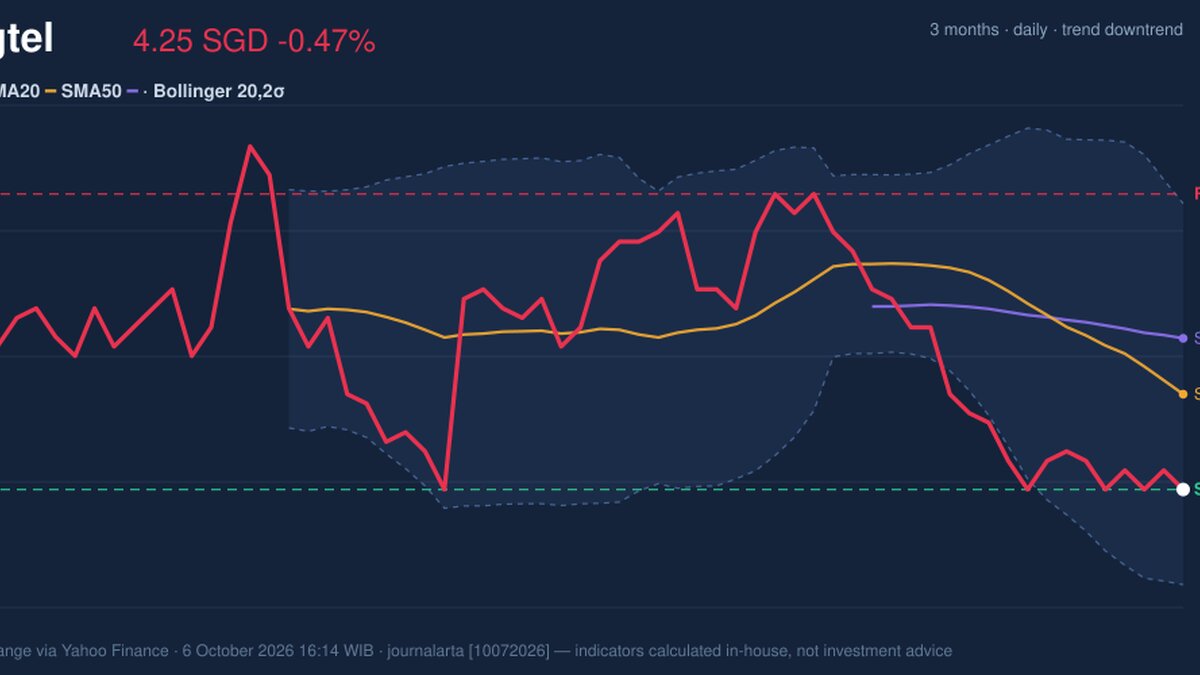
Singtel closed at S$4.25 on the Singapore Exchange on October 6, down 0.47% from the previous close, as its share price remained below both key moving averages and selling pressure persisted. The move leaves the stock at the bottom of its recent trading range: the technical picture signals a weakening trend, although low volatility and a near-term support level make a decisive breakdown the next test.
Trend & Price Action
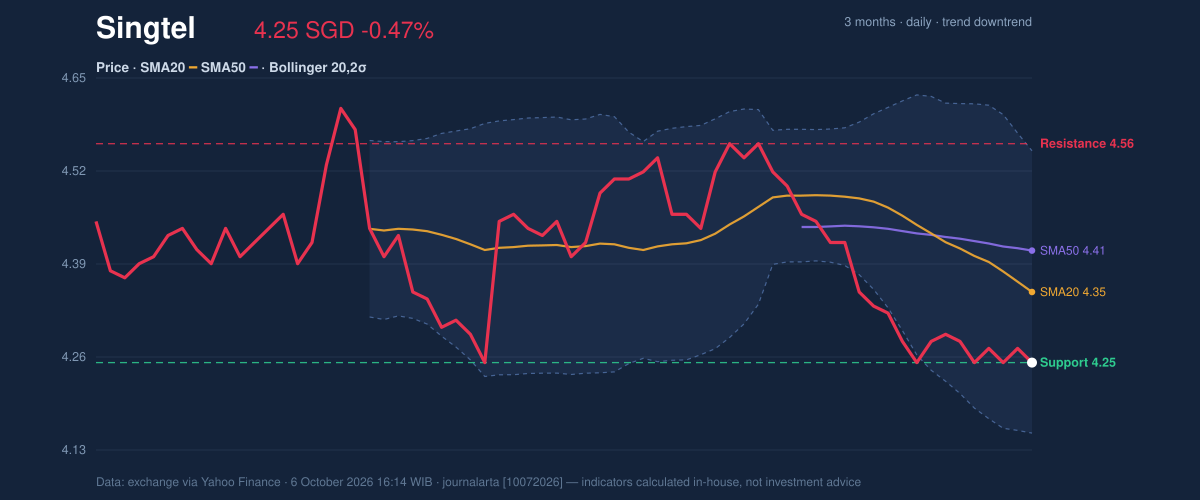
Singtel has fallen 0.70% over five trading days and 6.39% over one month. Its 20-day simple moving average (SMA), which tracks the average closing price over that period, is S$4.35 and sloping down 1.39% over five days. The 50-day average stands at S$4.41. Trading below both averages points to a market that has yet to establish a recovery, while the absence of a recent crossover means there is no fresh moving-average signal to suggest the trend has turned.
The shares sit at the lower boundary of the 20-day range, with support at S$4.25 and resistance at S$4.56. They have also moved close to the three-month low of S$4.19, well below the three-month high of S$4.70. Bollinger Bands, which frame a stock’s typical price variation around an average, run from S$4.15 to S$4.55, with the middle band at S$4.35. At 25% of the way between the bands, the price is in the lower portion of its recent volatility range—not, by itself, proof that a rebound is imminent.
Oscillators & Momentum
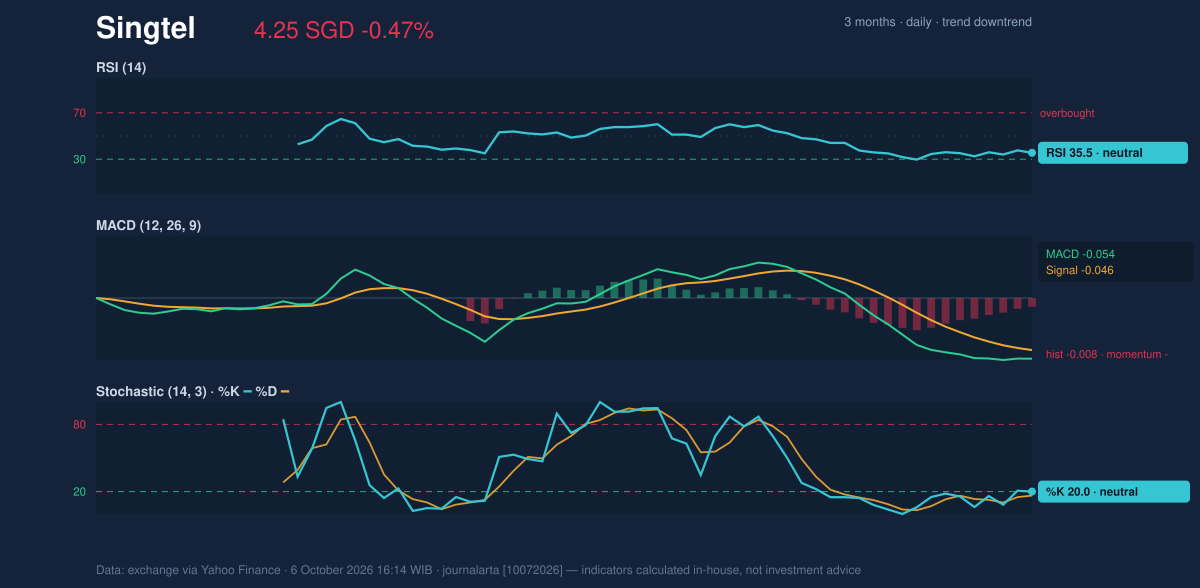
Momentum indicators are weak but do not yet show an unambiguous oversold reversal. The relative strength index (RSI), which measures the pace of recent gains and losses, is 35.5 and classified as neutral in the supplied data. The stochastic oscillator, comparing the latest close with its recent trading range, is also marked neutral, with %K at 20.0 and %D at 16.4. Their low readings show that the price has been pressing toward the lower end of its range, but they do not confirm that buyers have taken control.
The MACD, a trend-and-momentum measure, is below its signal line: -0.054 versus -0.046, with a histogram of -0.008. That negative configuration reinforces the downtrend rather than contradicting it. A sustained improvement would require momentum to strengthen alongside the price, rather than relying on the oscillators’ low readings alone.
Volatility, Volume & Key Levels
The Bollinger Band width is 9.2%, described as normal, so the data do not point to an unusually tight squeeze that might precede a sharp move. Average true range (ATR), a measure of typical price movement, is S$0.06, or 1.5% of the share price. That indicates relatively low volatility: daily swings have been modest, even as the broader direction has weakened.
Volume was 19.56 million shares, about 0.9 times the 20-day average of 20.71 million, while on-balance volume (OBV)—a running measure that adds volume on rising sessions and subtracts it on falling ones—was declining. The combination suggests the latest move was not accompanied by unusually heavy trading, but the falling OBV offers little evidence of accumulating buying interest.
The levels frame a conditional test. Holding S$4.25 would keep the shares at the identified 20-day support, but a break below it would expose the three-month low of S$4.19. A move above S$4.35 would reclaim the 20-day average; resistance at S$4.56 remains the next stated ceiling, with the S$4.70 three-month high beyond it. A close below S$4.25 would weaken the technical setup further, while a sustained move above S$4.35 would be an initial sign of recovery.
Technical Verdict: HOLD (wait & see)
HOLD (wait & see) is the technical reading: the price is at support, but the evidence for a durable turn remains limited.
- Reasons: the share price is below the falling SMA20 and SMA50; MACD remains negative; and OBV is declining. These signals keep the trend tilted downward despite neutral RSI and stochastic readings.
- Ideal entry range: S$4.25–S$4.35, bounded by 20-day support and the SMA20. This is a technical reference range, not a forecast.
- Exit target (target price): S$4.56, the stated 20-day resistance.
- Stop-loss protection: S$4.15, the lower Bollinger Band; this level is below the identified support and gives the setup room to fluctuate within the band.
- Invalidation condition: the verdict is invalidated if the price falls below S$4.19, the three-month low, indicating a break beneath the broader low reference as well as the 20-day support.
For non-traders, the indicators show a weak trend near support, but no confirmed reversal.
The supplied market data were timestamped October 6, 2026, at 16:14 WIB.
Summary Data Singtel
| Last price | 4.25 SGD |
| Change 1 day / 5 days / 1 month | -0.47% / -0.70% / -6.39% |
| Trend / MA-cross | downtrend / none |
| SMA20 / SMA50 | 4.35 / 4.41 |
| RSI (14) / Stochastic %K | 35.5 / 20.0 |
| Bollinger %B / ATR | 25% / 0.06 |
| Support / Resistance 20 days | 4.25 / 4.56 |
| Data as of | 6 October 2026 16:14 WIB |
Track Singtel share price daily: live levels, support/resistance and our full Singtel analysis history.