Testing Key Resistance, DBS Stock Gains 0.94% on Tuesday
On October 6, 2026: price 78.56 SGD, trend sideways, RSI 61.7, support 76.75, resistance 78.56. technical analysis of dbs stock. Testing Key Resistance — full…
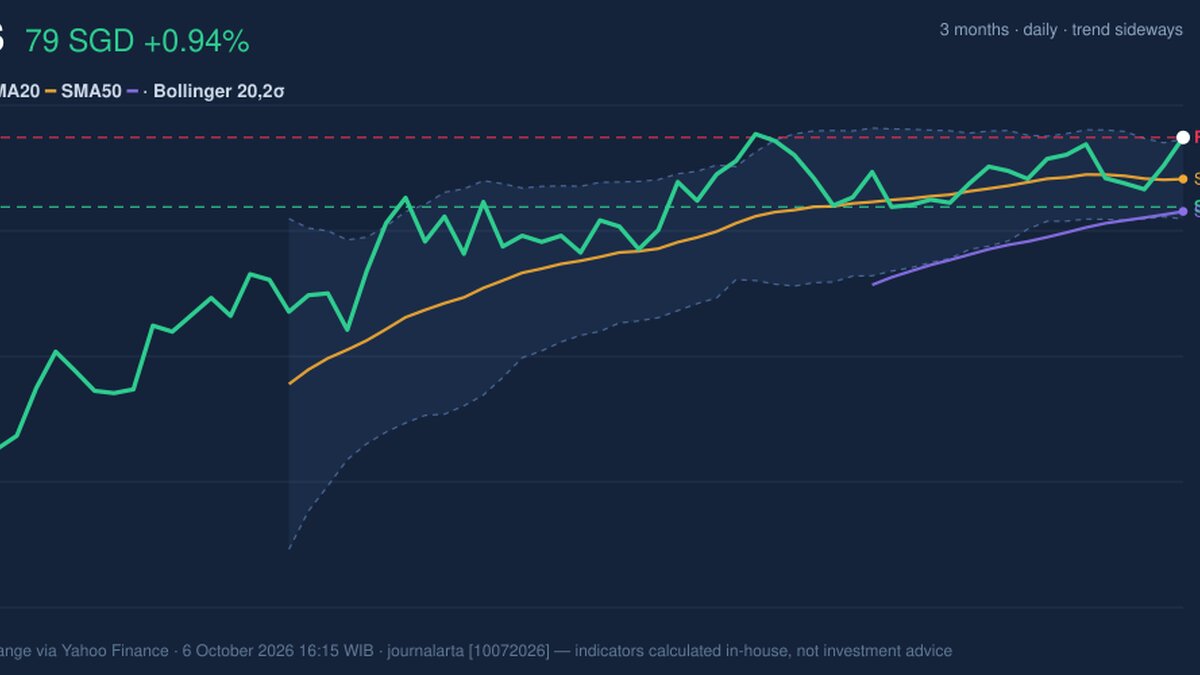
DBS Group rose 0.94% to S$78.56 on 6 October, putting the share at its 20-day resistance and just above the upper Bollinger band. The gain leaves the stock slightly higher over five trading days and the past month, but the broader technical picture is still sideways: the short-term average is edging down, while momentum indicators do not yet agree on whether the advance has strength behind it.
Trend & Price Action
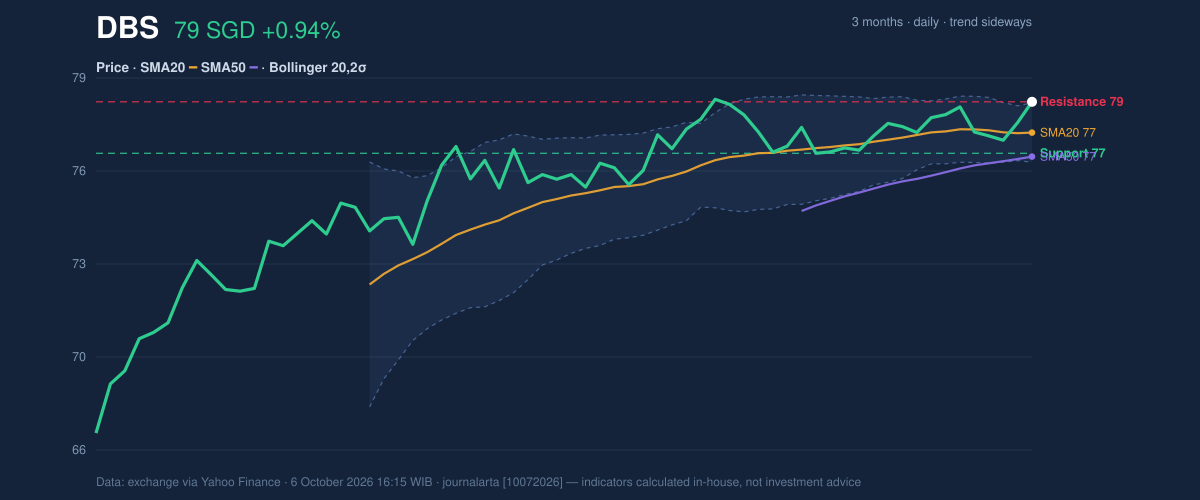
Data from the Singapore Exchange via Yahoo Finance show DBS trading above its SMA20 of S$77.48 and SMA50 of S$76.63. That positioning is constructive, but neither moving average has crossed the other recently, so there is no fresh signal of a change in the medium-term trend. The SMA20’s 0.15% decline over five days also cautions against reading the latest rise as a confirmed trend reversal.
The share is at the top of its 20-day range, with resistance at S$78.56 and support at S$76.75. It remains below the three-month high of S$79.05, while standing well above the three-month low of S$66.48. The position near the range ceiling makes the next move more informative than the daily gain alone.
As shown in the chart, price has moved above the upper Bollinger band at S$78.52, with %B at 102%. The band tracks recent price variation; a reading above 100% means the share has pushed beyond its upper boundary. That can reflect strong buying, but in a sideways market it can also signal a move that is stretched relative to recent trading.
Oscillators & Momentum
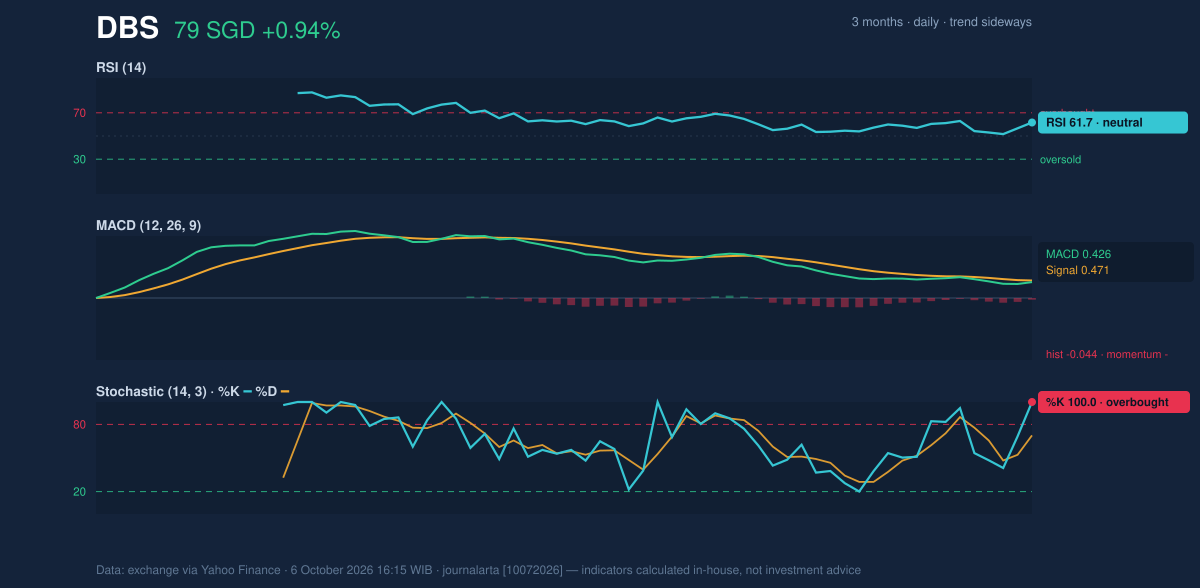
The momentum readings are mixed. RSI is 61.7, a neutral reading that points to positive momentum without showing an extreme on that measure. By contrast, Stochastic %K at 100.0 versus %D at 70.2 is overbought. The stochastic compares a closing price with its recent range; at this level, it suggests the recent rise has been sharp enough to leave the share vulnerable to a pause.
MACD momentum is negative: its reading of 0.426 is below the 0.471 signal line, leaving a histogram of -0.044. MACD compares shorter- and longer-term price momentum, and this configuration indicates that the latest price strength has not yet translated into improving momentum on that measure. The chart helps show why a single green session is not enough to settle the direction.
Volatility, Volume & Key Levels
The Bollinger bands are narrow, with a width of 2.7%, indicating compressed recent price movement. A squeeze can precede a larger move, but it does not determine whether that move will be upward or downward. ATR is S$0.87, or 1.1% of the share price, consistent with relatively low recent volatility.
Volume was 3,881,380 shares, close to the 20-day average of 3,819,657, so participation was roughly normal rather than unusually strong. OBV, a running measure of buying and selling volume, is declining. That divergence weakens the case that the price rise is being broadly confirmed by trading flows.
A sustained break above S$78.56 would clear the stated 20-day resistance and could put the three-month high of S$79.05 in focus. Failure to hold S$76.75 would instead expose the area around the SMA20 and SMA50 as the next reference points. With the bands squeezed and indicators divided, either level needs confirmation rather than assumption.
Technical Verdict: HOLD (wait & see)
The technical balance is HOLD (wait & see): price is above both moving averages, but weakening MACD momentum and falling OBV temper the breakout signal. The overbought stochastic adds a further reason for caution, while the tight Bollinger bands leave the direction of any expansion unresolved.
- Illustrative entry range: S$76.75–S$77.48, defined by 20-day support and the SMA20.
- Illustrative exit target: S$79.05, the three-month high and nearest stated higher reference level.
- Illustrative stop-loss protection: below S$76.44, the lower Bollinger band.
The verdict is invalidated if price falls below S$76.75, as that would break the stated 20-day support. For non-traders, the signals are too mixed to show whether the move can hold above resistance.
Technical analysis for informational purposes only; it is not an investment recommendation.
Summary Data DBS
| Last price | 78.56 SGD |
| Change 1 day / 5 days / 1 month | 0.94% / 0.23% / 0.59% |
| Trend / MA-cross | sideways / none |
| SMA20 / SMA50 | 77.48 / 76.63 |
| RSI (14) / Stochastic %K | 61.7 / 100.0 |
| Bollinger %B / ATR | 102% / 0.87 |
| Support / Resistance 20 days | 76.75 / 78.56 |
| Data as of | 6 October 2026 16:15 WIB |
Track DBS share price daily: live levels, support/resistance and our full DBS analysis history.