Testing Key Resistance, OCBC Stock Gains 1.00% on Tuesday
On October 6, 2026: price 32.20 SGD, trend sideways, RSI 59.5, support 31.00, resistance 32.22. technical analysis of ocbc stock. Testing Key Resistance — full…
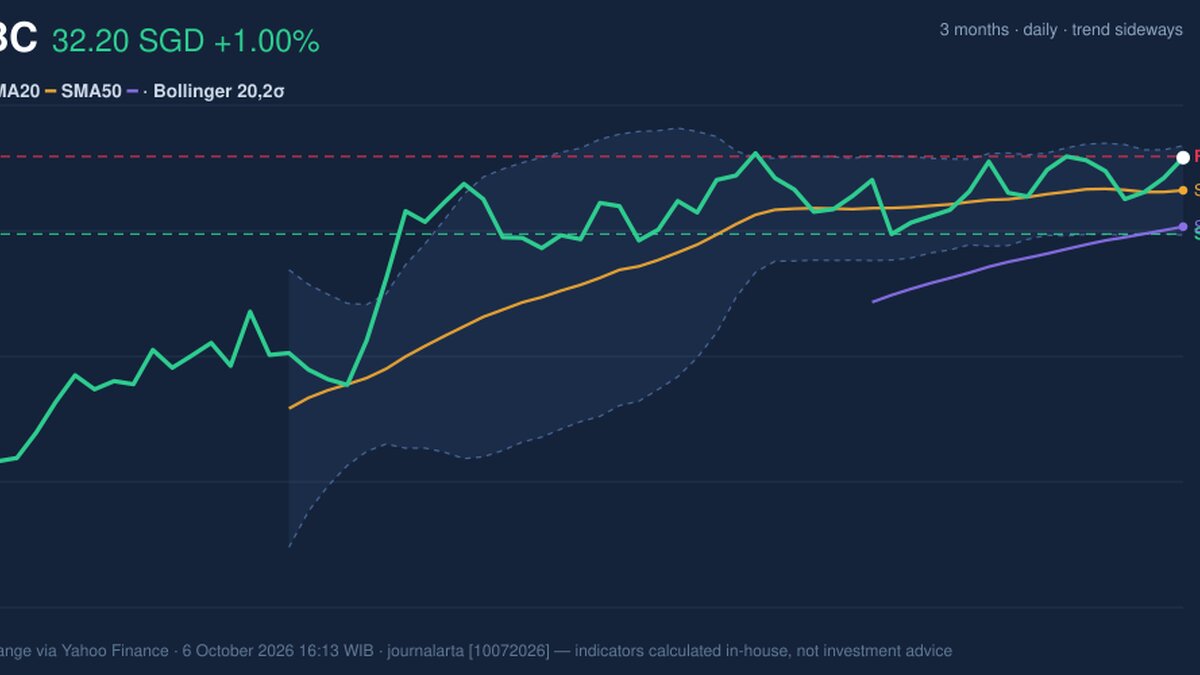
OCBC Bank rose 1.00% to SGD 32.20 on 6 October, according to market data via Yahoo Finance, leaving the Singapore-listed stock just below its recent resistance as subdued volatility and mixed momentum indicators complicate the bullish signal from the day’s gain. The price is above its short- and medium-term moving averages, but the indicators point to a market that is advancing cautiously rather than with broad confirmation.
Trend & Price Action
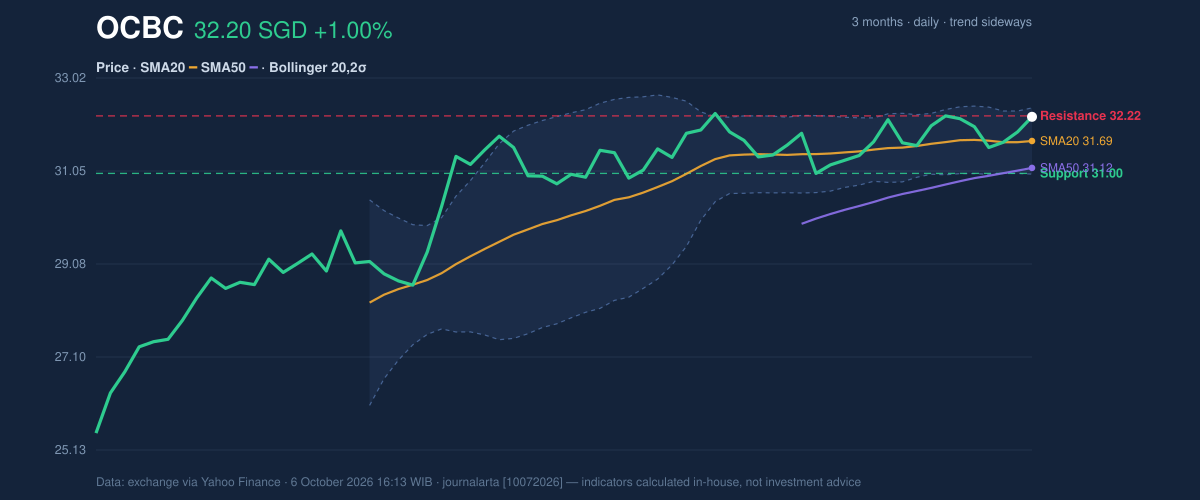
The shares are trading above the SMA20 at SGD 31.69 and SMA50 at SGD 31.12. That positioning suggests the price structure remains constructive, although there has been no fresh moving-average crossover to signal a decisive shift in trend. The SMA20’s slight downward slope and the broader sideways classification temper the message: the stock has held above its averages, but has not established a clear upward trend.
At SGD 32.20, OCBC is near the upper end of its 20-day range, with resistance at SGD 32.22 and support at SGD 31.00. It is also below the three-month high of SGD 32.57. The proximity to resistance makes the next move important: a sustained break above the near-term ceiling would strengthen the case that buyers are taking control, while a retreat would leave the recent range intact.
As shown in the chart, the stock is close to the upper Bollinger Band, with the bands narrowing around the price. That squeeze means recent volatility has been muted and a larger move may follow, but it does not predict the direction. With the upper band at SGD 32.39 and the lower band at SGD 30.99, the chart shows a relatively tight range around the current price.
Oscillators & Momentum
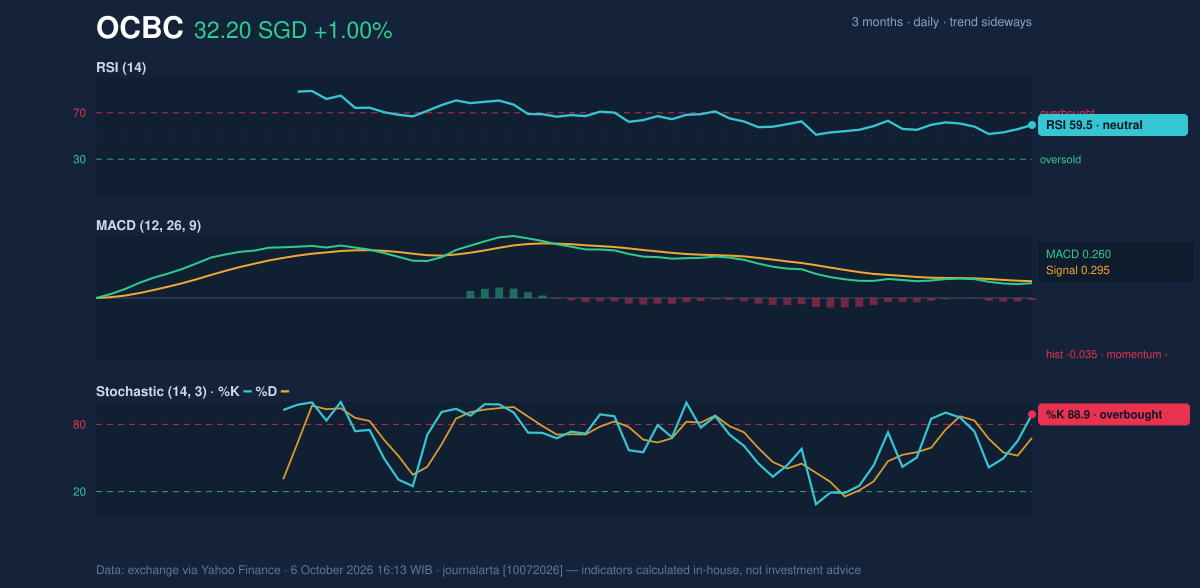
The momentum indicators offer a mixed reading. The RSI at 59.5 is neutral, consistent with a market that has gained ground without reaching an extreme. The Stochastic reading is overbought, with %K at 88.9 above %D at 67.9, suggesting the recent move may have run ahead of its underlying pace and could be vulnerable to a pause.
MACD adds a note of caution. Its value of 0.260 is below the signal line at 0.295, and the histogram is negative at -0.035. In plain terms, the indicator’s short-term momentum has weakened even though the share price remains above both moving averages. That divergence is not proof of an imminent reversal, but it means the latest price strength is not yet matched by improving momentum.
As shown in the momentum chart, the neutral RSI contrasts with the overbought Stochastic and negative MACD histogram, highlighting the lack of a unified signal.
Volatility, Volume & Key Levels
Trading volume was 6,896,130 shares, about 1.1 times its 20-day average of 6,141,859. That is modestly above normal and gives the session’s rise some participation, but the falling OBV—an indicator that tracks whether volume is accumulating on up days or down days—does not confirm a strong build-up of buying pressure.
ATR stands at SGD 0.44, or 1.4% of the share price, pointing to low recent volatility. A breakout could therefore change the stock’s near-term character, particularly with the Bollinger bands squeezed. A hold above SGD 32.22 would put the three-month high of SGD 32.57 in focus; failure at resistance could instead leave the price rotating toward support near SGD 31.00. The narrowing bands identify the possibility of expansion, not a reliable signal of which boundary will give way first.
Technical Verdict: HOLD (wait & see)
The technical picture supports a HOLD (wait & see) verdict: price remains above both moving averages, but overbought Stochastic and weakening MACD momentum argue against treating the latest rise as confirmed. The main signals are the constructive position above SMA20 and SMA50, the negative MACD histogram, and the narrow Bollinger bands alongside falling OBV. The verdict is invalidated if the price falls below SGD 31.00.
- Ideal Entry Range: SGD 31.69–32.22, bounded by the SMA20 and near-term resistance.
- Exit Target (Target Price): SGD 32.39–32.57, from the upper Bollinger Band to the three-month high.
- Stop Loss protection: SGD 30.99, at the lower Bollinger Band.
For non-traders, this means the chart is balanced: the share price is holding above key averages, but a clearer momentum signal is still needed.
Summary Data OCBC
| Last price | 32.20 SGD |
| Change 1 day / 5 days / 1 month | 1.00% / 0.12% / 1.58% |
| Trend / MA-cross | sideways / none |
| SMA20 / SMA50 | 31.69 / 31.12 |
| RSI (14) / Stochastic %K | 59.5 / 88.9 |
| Bollinger %B / ATR | 86% / 0.44 |
| Support / Resistance 20 days | 31.00 / 32.22 |
| Data as of | 6 October 2026 16:13 WIB |
Track OCBC share price daily: live levels, support/resistance and our full OCBC analysis history.