On October 6, 2026: price 68.80 HKD, trend downtrend, RSI 25.9, support 68.80, resistance 77.35. technical analysis of aia stock. AIA Stock Drops — full…
By matthew jonathan
October 6, 20264 min read
AIA Stock Drops 0.22% on Tuesday, RSI Oversold
AIA Group closed at HKD 68.80 on 6 October, down 7.09% over five trading days, as its shares traded below both key moving averages and near the lower edge of their recent range. The price action points to persistent selling pressure, while deeply oversold momentum readings raise the possibility of a short-term pause—but do not yet confirm a reversal.
Trend & Price Action
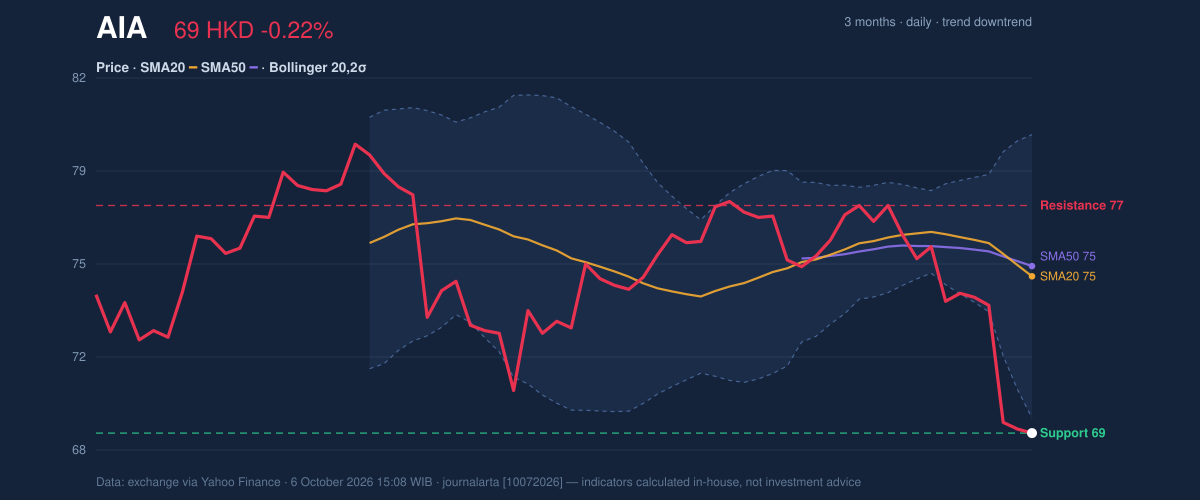
AIA is in a downtrend: the 20-day simple moving average (SMA) has fallen 1.93% over five trading days, and the share price sits below the 20-day SMA at HKD 74.69 and the 50-day SMA at HKD 75.07. The 20-day average has crossed below the 50-day average, a death cross that signals weakening near-term price structure rather than a confirmed floor.
The gap between the last price and those averages is substantial. That suggests recent declines have outpaced the trend lines, leaving the stock vulnerable if selling continues, though sharp falls can also create conditions for a rebound. AIA is at the bottom of its 20-trading-day range, with support at HKD 68.80 and resistance at HKD 77.35. Over three months, it has ranged from HKD 68.00 to HKD 80.15.
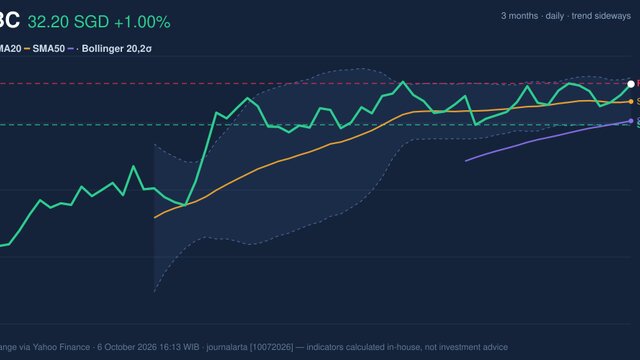
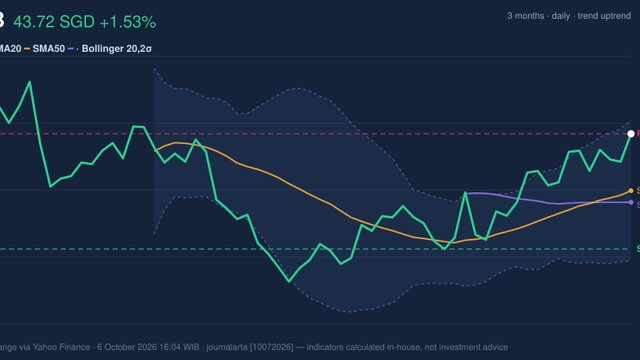
3-month price action chart of AIA: price, SMA20/50, Bollinger, support & resistance. Data: exchange via Yahoo Finance.
Oscillators & Momentum
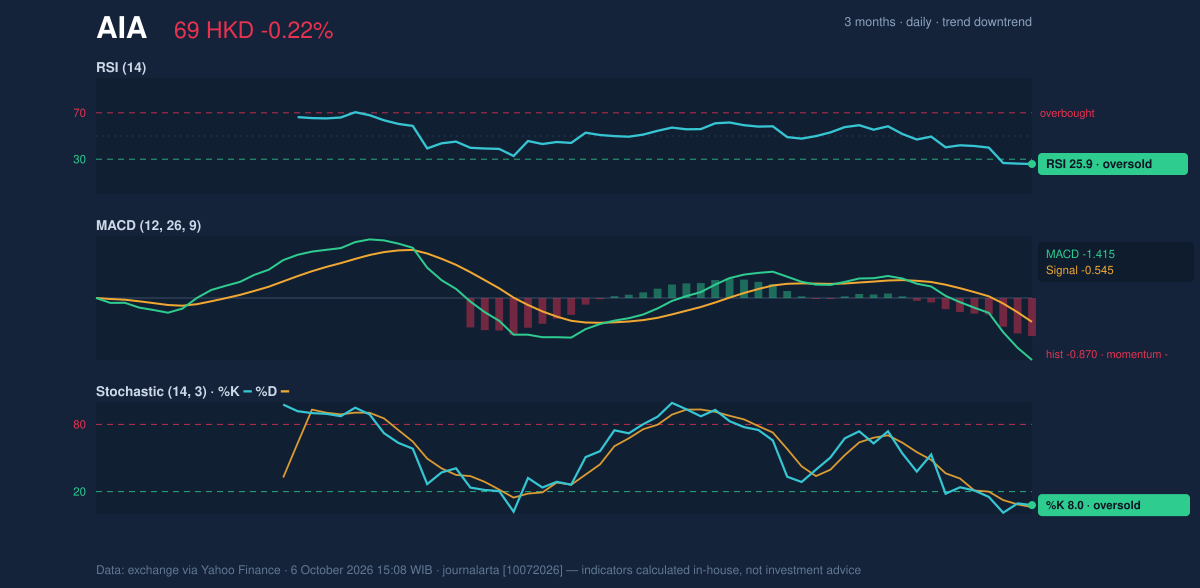
The Relative Strength Index (RSI), which gauges the pace of recent gains and losses, is 25.9, in oversold territory. The Stochastic readings are also oversold, with %K at 8.0 and %D at 6.2. These levels show that selling has been intense relative to recent trading; they can precede a bounce, but oversold readings alone do not establish that a decline has ended.
The Moving Average Convergence Divergence (MACD), a trend-and-momentum measure, remains negative at -1.415, below its -0.545 signal line, with a negative histogram of -0.870. That alignment indicates downward momentum still has confirmation from the trend indicator. A sustained improvement in momentum would be more convincing if the MACD began narrowing toward its signal line as price stabilised.
Momentum chart of AIA: RSI(14), MACD, Stochastic. Data: exchange via Yahoo Finance.
Volatility, Volume & Key Levels
AIA’s price is below the lower Bollinger Band at HKD 69.37, with %B at -5%. Bollinger Bands track a price’s position relative to a moving average and its recent volatility; a reading below the lower band means the share has moved beyond its usual banded range. The band width of 14.3% is described as normal, not unusually compressed or expanded, so the signal is an extended downside move rather than a volatility squeeze. Average True Range (ATR) is HKD 1.96, or 2.8% of the share price, indicating moderate daily price movement.
Volume was 27,006,599 shares, about 1.0 times the 20-day average of 28,348,708, while On-Balance Volume (OBV) is falling. Near-normal turnover means the decline has not been accompanied by an exceptional surge in trading, but falling OBV suggests buying pressure has not yet offset the selling.
The immediate test is whether HKD 68.80 holds. A break below that 20-day support would put the three-month low of HKD 68.00 in focus; a failure there would mark a further deterioration in the chart. If support holds, oversold oscillators leave room for a relief bounce, but HKD 74.69–75.07—the SMA20 and SMA50 area—would be an important hurdle, followed by resistance at HKD 77.35.
Technical Verdict: HOLD
HOLD (wait & see) reflects the clash between washed-out short-term readings and a still-negative trend. RSI and Stochastic are oversold, but the death cross, negative MACD and falling OBV do not yet confirm a durable turn. The verdict is invalidated if price falls below HKD 68.00, the three-month low.
- Ideal Entry Range: HKD 68.00–69.37, based on the three-month low and lower Bollinger Band.
- Exit Target (Target Price): HKD 74.69–77.35, spanning the SMA20 and 20-day resistance.
- Stop Loss: Below HKD 68.00, the three-month low.
For non-traders, the chart shows a weak trend with signs of short-term exhaustion, but no clear reversal signal yet.