UOB Stock Analysis: Gains 1.53%, Golden Cross Formed
On October 6, 2026: price 43.72 SGD, trend uptrend, RSI 63.7, support 40.99, resistance 43.72. technical analysis of uob stock. UOB Stock Analysis — full…
By Elena Vance
October 6, 20264 min read
UOB Stock Analysis
United Overseas Bank shares rose 1.53% to SGD 43.72 on the Singapore Exchange on 6 October, putting the stock at the top of its 20-trading-day range and just below its recent three-month high. The advance extends gains of 0.92% over five days and 5.10% over one month. Price action is constructive, but the proximity to resistance and an overbought short-term oscillator mean the rise is also testing how much momentum remains.
Trend & Price Action
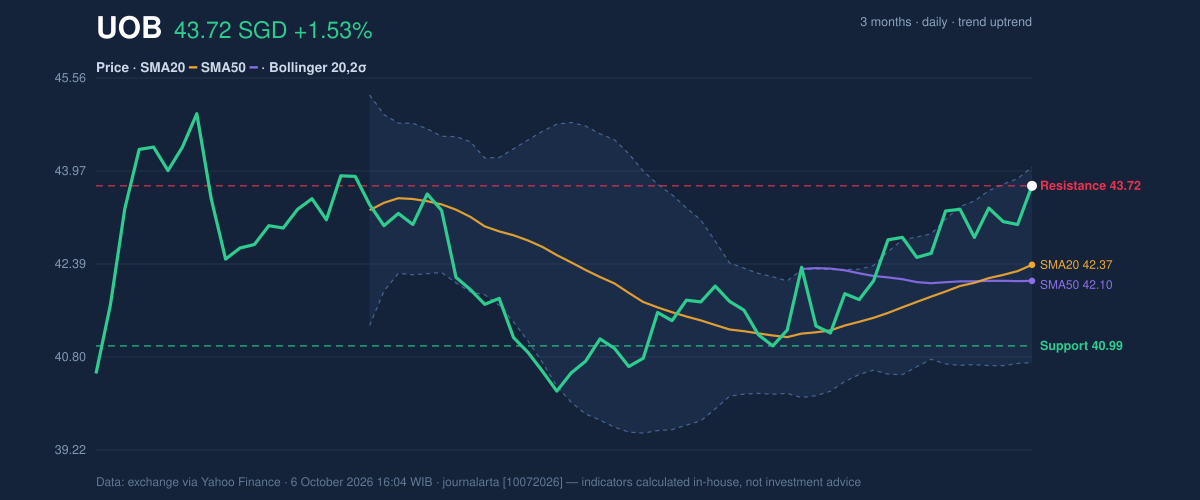
UOB trades above its 20-day simple moving average (SMA) of SGD 42.37 and its 50-day SMA of SGD 42.10. The 20-day average is rising, with its slope at 0.86% over five days, while the short-term average has crossed above the longer-term one—a golden cross. This combination indicates that recent buying has strengthened the trend rather than merely lifting the share price for a single session.
But the stock has reached the SGD 43.72 resistance level identified from its 20-day range. It is also approaching the three-month high of SGD 45.15. That leaves a clear test: a sustained move beyond resistance would show that buyers can push through the recent ceiling; a failure to hold gains would bring the moving averages and lower support levels back into focus.
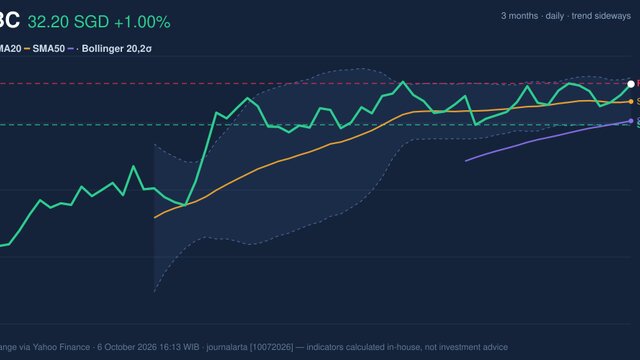
3-month price action chart of UOB: price, SMA20/50, Bollinger, support & resistance. Data: exchange via Yahoo Finance.
Oscillators & Momentum
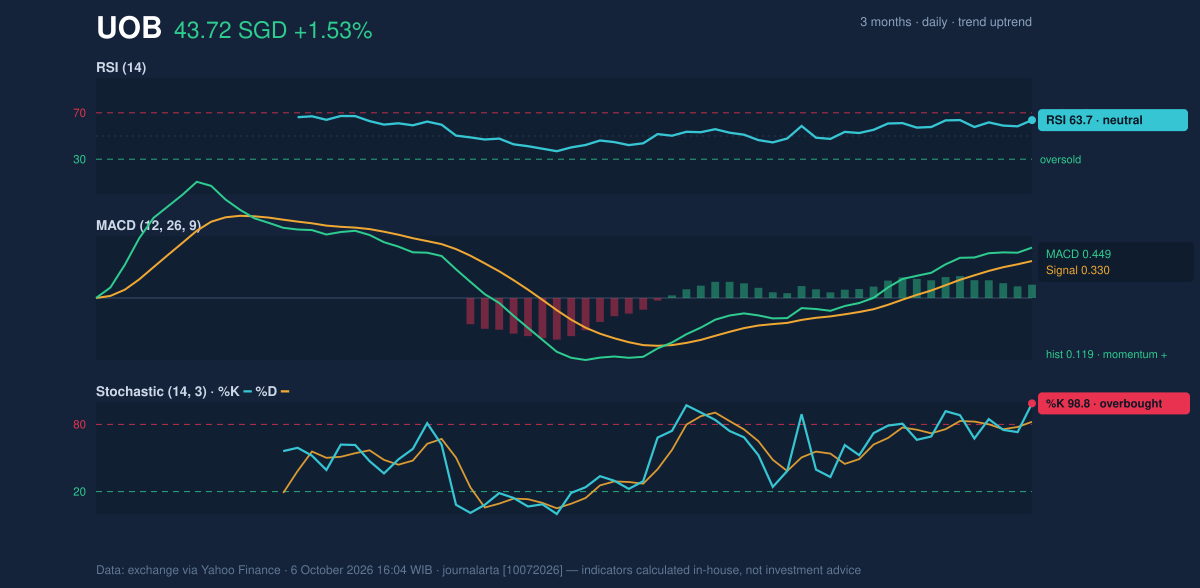
Momentum indicators largely support the upward trend, though they do not all point to the same near-term risk. The RSI is 63.7, a neutral reading: it shows positive momentum without, by itself, signalling that the stock has entered an extreme condition. The MACD line is above its signal line, with a positive histogram, indicating that upward momentum is still in place.
The sharper caution comes from the Stochastic %K at 98.8 and %D at 82.3, both pointing to an overbought condition. Stochastic compares a recent close with the stock’s recent trading range; a high reading can mean buyers have driven the price close to the top of that range, but it is not a timing signal on its own. Together, the indicators describe a rising trend with strong momentum, alongside a greater chance of a pause or pullback near resistance.
Momentum chart of UOB: RSI(14), MACD, Stochastic. Data: exchange via Yahoo Finance.
Volatility & Volume
The share price is near the upper Bollinger Band at SGD 44.04, with the band position (%B) at 90%. Bollinger Bands measure how far price has moved from its recent average relative to typical variation. Being close to the upper band is consistent with strength, but it also means the stock is trading near the upper end of its recent statistical range.
The bands have narrowed to 7.9%, a squeeze that signals subdued recent volatility and the potential for a larger move, though not its direction. The average true range (ATR) is SGD 0.82, or 1.9% of the share price, indicating moderate day-to-day movement. Volume of 4,325,050 shares was 1.1 times its 20-day average, while on-balance volume (OBV) is rising. That gives the advance some participation behind it, rather than leaving the price move unsupported by trading activity.
Key Levels & Scenarios
The immediate hurdle is SGD 43.72, with the upper Bollinger Band at SGD 44.04 and the three-month high at SGD 45.15 above it. If the price clears and holds above the near-term ceiling, those higher levels become the next reference points. If it fails to hold the breakout area, the 20-day SMA at SGD 42.37 and 50-day SMA at SGD 42.10 are the first trend markers to watch.
Below those averages, SGD 40.99 is 20-day support, while the lower Bollinger Band at SGD 40.71 marks another technical reference. The three-month low of SGD 39.80 gives broader context for the range. A move below support would weaken the current positive structure; a pullback that holds above the moving averages would be less damaging to the trend.
Technical Verdict: HOLD
The indicators lean positive, but price is testing resistance while Stochastic is overbought. A HOLD (wait & see) reading reflects that tension rather than a clear trend reversal.
Ideal entry range: SGD 42.10–42.37, around the 50-day and 20-day SMAs.
Exit target (target price): SGD 44.04–45.15, from the upper Bollinger Band to the three-month high.
Stop-loss protection: SGD 40.71, at the lower Bollinger Band.
The verdict is invalidated if UOB falls below SGD 40.99, its 20-day support level. In plain English, the trend remains healthy, but the stock is near a ceiling and needs to show whether it can break through.
Data table — UOB (U11.SI), as of 6 October 2026, 16:04 WIB