BP Momentum Weakens: Stock Drops 1.45% (September 29, 2026)
On September 29, 2026: price 563.50 GBp, trend uptrend, RSI 54.1, support 514.50, resistance 580.30. technical analysis of bp stock. BP Momentum Weakens — full…

BP plc is still holding above its short-term trend, but the latest tape shows a market that is advancing more by structure than by conviction.
BP shares on the LSE last changed hands at 563.50 GBp, down 1.45% on the day from 571.80 the previous close, according to exchange-linked market data via Yahoo Finance. Even so, the stock remains above its SMA20 at 553.73 and above its SMA50 at 540.91, which matters because prices above both moving averages usually indicate that the broader short-term trend is still intact. The question now is not whether BP is trending higher — the chart still says it is — but whether buyers have enough energy to push through the recent ceiling.
Trend & Price Action
The price structure is constructive, but not cleanly decisive. BP is in an uptrend, helped by an SMA20 slope of 1.12% over 5 days, which signals that the short-term average is still rising rather than flattening out. That is an important detail: a rising moving average often means pullbacks are being absorbed rather than turning into a broader reversal.
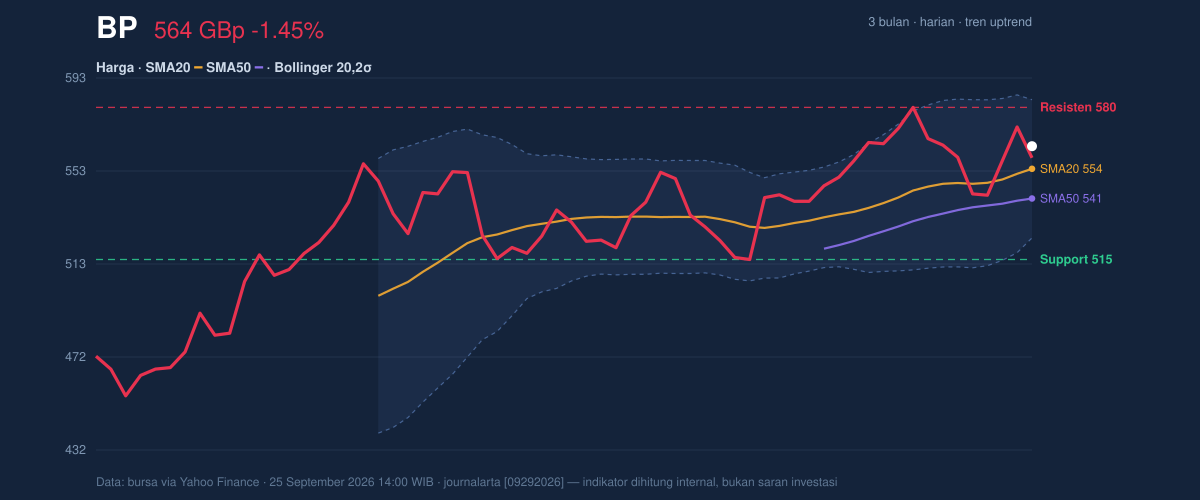
As shown in the chart, BP is trading in the upper part of its recent range. The stock sits at 74% of the 20-hour range, between support at 514.50 and resistance at 580.30. It is also close to its 3-month high of 582.60 and well above the 3-month low of 450.60. That positioning tells readers the market has already done most of the heavy lifting; what remains is either a breakout attempt or a pause to digest gains.
The Bollinger setup reinforces that view. BP is trading inside the band structure, with the middle band at 553.73 and the upper band at 583.60. The price is above the middle band but below the upper band, a zone that often reflects a healthy trend without immediate breakout confirmation. The %B reading of 66% suggests the stock is in the upper part of its volatility envelope, but not stretched to an extreme. The 10.8% band width is normal, which means the market is not in a squeeze that usually precedes a sharp move, nor in an expansion phase that would imply a sudden trend acceleration.
Oscillators & Momentum
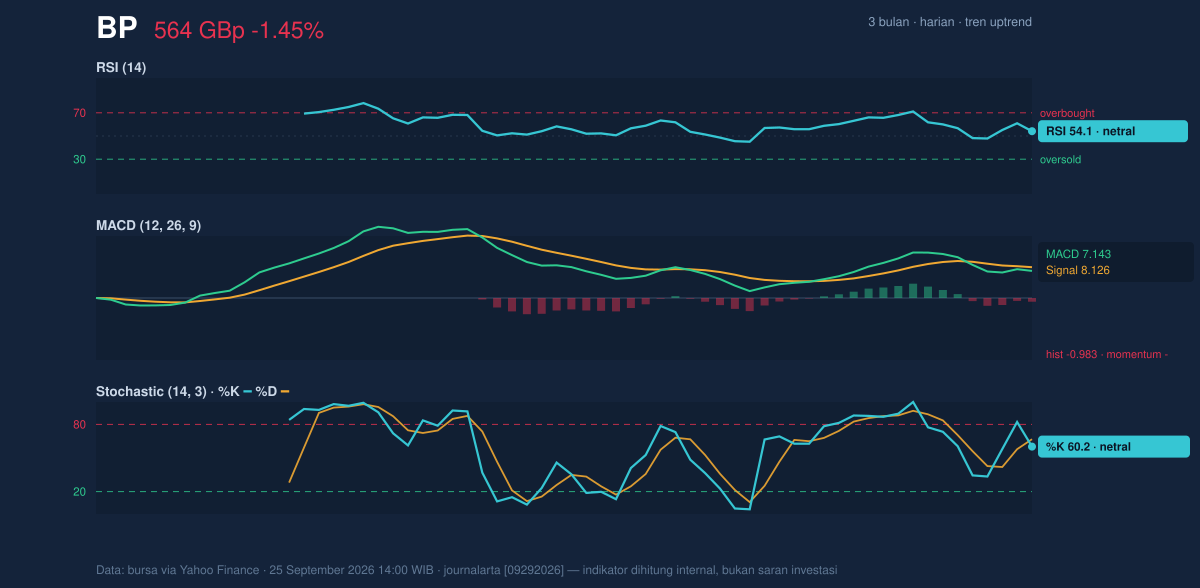
Momentum is more mixed than the trend line suggests. The RSI at 54.1 is neutral, which means BP is neither overbought nor oversold. In plain terms, the market is not screaming exhaustion, but it is also not showing strong urgency. The Stochastic %K at 60.2 and %D at 66.8 also sit in neutral territory, though the %K below %D hints that near-term momentum has softened a little.
The clearest warning comes from MACD. BP’s MACD at 7.143 remains below the signal line at 8.126, leaving a histogram of -0.983. That negative histogram means the recent pace of gains has slowed relative to the longer trend, even while price remains above its moving averages. This is not a bearish reversal signal on its own, but it does show that the rally is losing some internal force. In chart terms, price is still elevated, but momentum is no longer fully confirming the move.
That mismatch matters because strong trends usually need momentum to line up with price. Here, the trend is positive, yet oscillators are neutral and MACD is negative. That combination often leads to consolidation rather than immediate continuation.
Volatility & Volume
Volatility remains manageable. The ATR(14) of 17.21, equal to 3.1% of price, indicates moderate day-to-day movement. This is enough for meaningful swings, but not so high that the stock appears disorderly. For readers, ATR is a measure of how much a share typically moves; a moderate reading suggests BP can still test nearby levels without needing a major catalyst.
Volume adds a more interesting layer. The latest session saw 81,693,829 shares traded, about 1.6 times the 20-day average of 49,538,317. That is a real participation spike, and in many cases it would be a positive signal. But the fact that OBV is falling complicates the picture. OBV, or on-balance volume, tracks whether volume is flowing into up days or down days. A falling OBV while price holds near the top of its range can mean distribution: shares are changing hands, but not all of that activity is supportive of further upside. In other words, the market is busy, but not necessarily aligned.
Key Levels & Scenarios
The immediate technical map is straightforward. Support at 553.73 — which also lines up with the SMA20 and the Bollinger middle band — is the first level to watch. A sustained move below that area would weaken the short-term trend structure and suggest BP is drifting back toward the middle of its recent range.
Below that, the next important floor is 514.50, the 20-hour support. A break there would be more serious because it would place the stock much closer to the lower end of the recent range and away from the trend-confirming moving averages.
On the upside, resistance at 580.30 is the near-term barrier, with the upper Bollinger band at 583.60 and the 3-month high at 582.60 clustering in the same area. That cluster matters: when multiple resistance markers sit on top of each other, the market often needs stronger momentum to clear them. If BP can reclaim that zone, it would indicate the current consolidation is resolving in favor of the trend.
Technical Verdict: HOLD (wait & see)
HOLD (wait & see)
- MACD is still negative versus its signal line, showing that upside momentum is not yet fully confirmed.
- RSI 54.1 and Stochastic 60.2 / 66.8 are neutral, which supports the idea of consolidation rather than a decisive breakout.
- Price remains above SMA20 and SMA50, so the trend has not broken; however, OBV is falling, which tempers confidence in the move.
Verdict invalidated if price falls below 553.73, because that would mean BP has lost the SMA20 and the Bollinger middle band.
- Ideal Entry Range: 553.73 to 563.50
- Exit Target: 580.30 to 583.60
- Stop Loss protection: 514.50
For non-traders, that means BP still looks technically supported, but the chart needs a stronger momentum signal before the next leg higher is confirmed.
Summary Data BP
| Last price | 563.50 GBp |
| Change 1 day / 5 days / 1 month | -1.45% / 0.86% / 9.33% |
| Trend / MA-cross | uptrend / none |
| SMA20 / SMA50 | 553.73 / 540.91 |
| RSI (14) / Stochastic %K | 54.1 / 60.2 |
| Bollinger %B / ATR | 66% / 17.21 |
| Support / Resistance 20 days | 514.50 / 580.30 |
| Data as of | 25 September 2026 14:00 WIB |



