BP Stock Analysis: Gains 1.09%, Momentum Weakens
On Oktober 6, 2026: price 563.20 GBp, trend uptrend, RSI 53.6, support 542.30, resistance 580.30. technical analysis of bp stock. BP Stock Analysis — full…
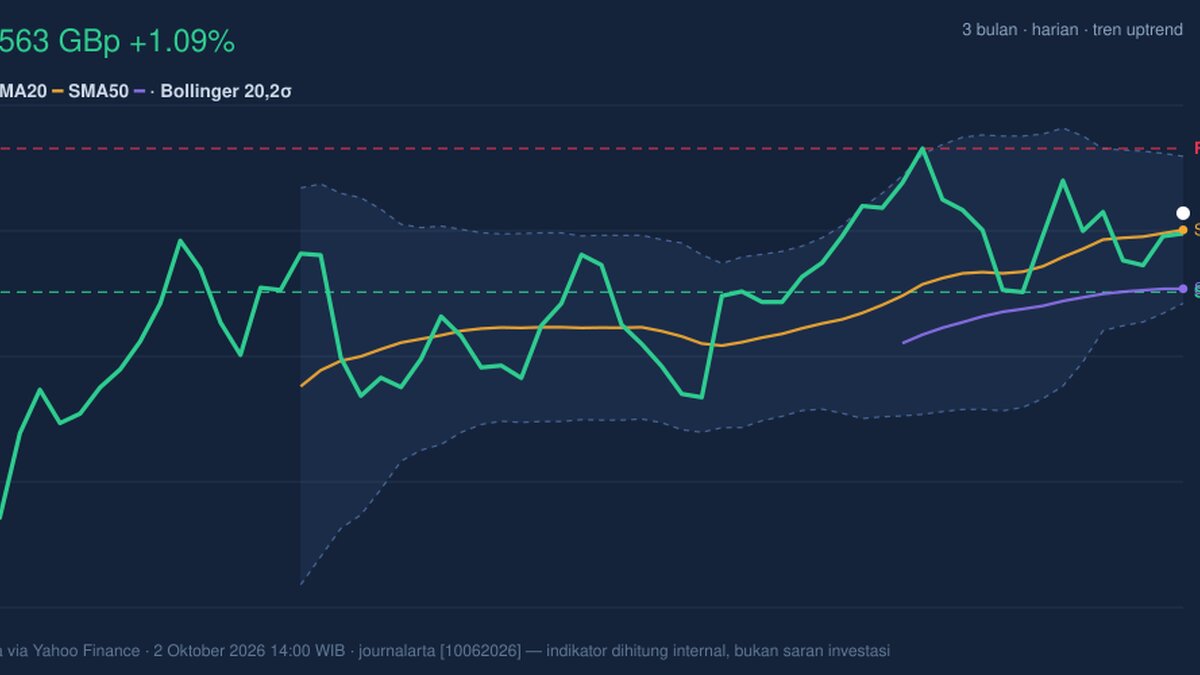
BP rose 1.09% to 563.20 GBp on the London Stock Exchange, extending its monthly gain to 4.35% as the share price held above its short- and medium-term averages. For international investors, the signal is a steady uptrend—but one with limited confirmation from trading volume and weaker short-term momentum.
The latest price, reported by the exchange via Yahoo Finance at 14:00 WIB on 2 October 2026, was up from the previous close of 557.10 GBp. The advance puts BP above its 20-day simple moving average (SMA), a measure of the average closing price over that period, and its 50-day SMA. That supports the broader positive trend, though there has been no recent crossover between the two averages to signal a fresh shift in direction.
Trend & Price Action
BP’s 20-day average is 558.77 GBp and has risen 0.91% over five days; its 50-day average is 543.21 GBp. With the share price above both, buyers have maintained control of the near-term structure. The averages’ current ordering is constructive, but the absence of a new crossover means the move is an extension of the existing trend, not a newly confirmed technical breakout.
The shares sit about midway between the 20-session support at 542.30 GBp and resistance at 580.30 GBp. That leaves room in either direction: a push through resistance would test the three-month high of 582.60 GBp, while a retreat toward support would test whether the trend can absorb renewed selling. As shown in the chart, price is also above the Bollinger middle band, but remains below the upper band.
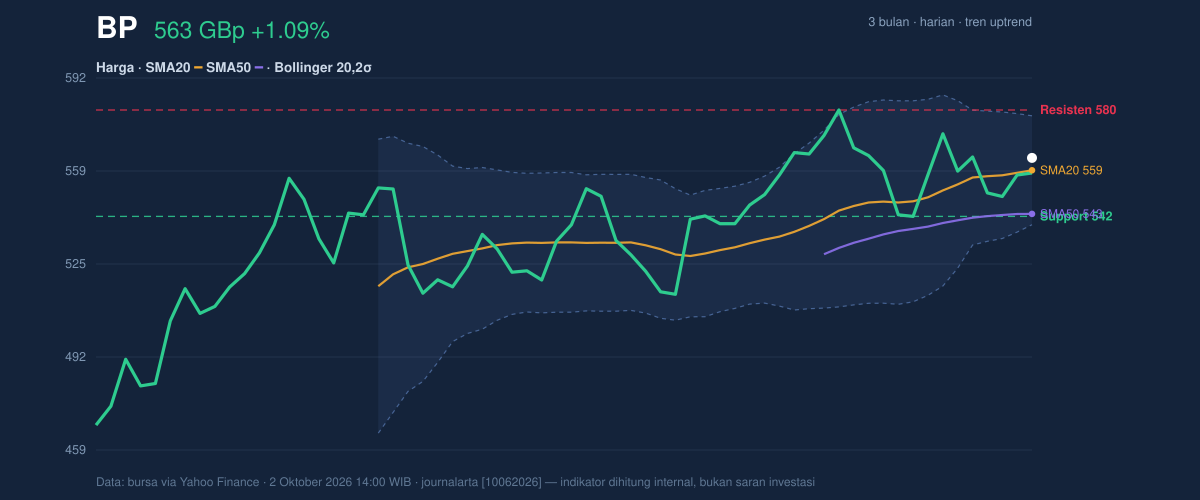
The price structure remains positive, but the move has yet to clear nearby resistance. The Bollinger bands—an indicator that tracks price relative to a recent average and its volatility—are narrowing, with a 7.0% width. Such a squeeze signals that recent price swings have contracted; it can precede a larger move, but does not determine its direction. BP’s %B reading of 61% places the price above the band midpoint and below the upper boundary of 578.21 GBp.
Oscillators & Momentum
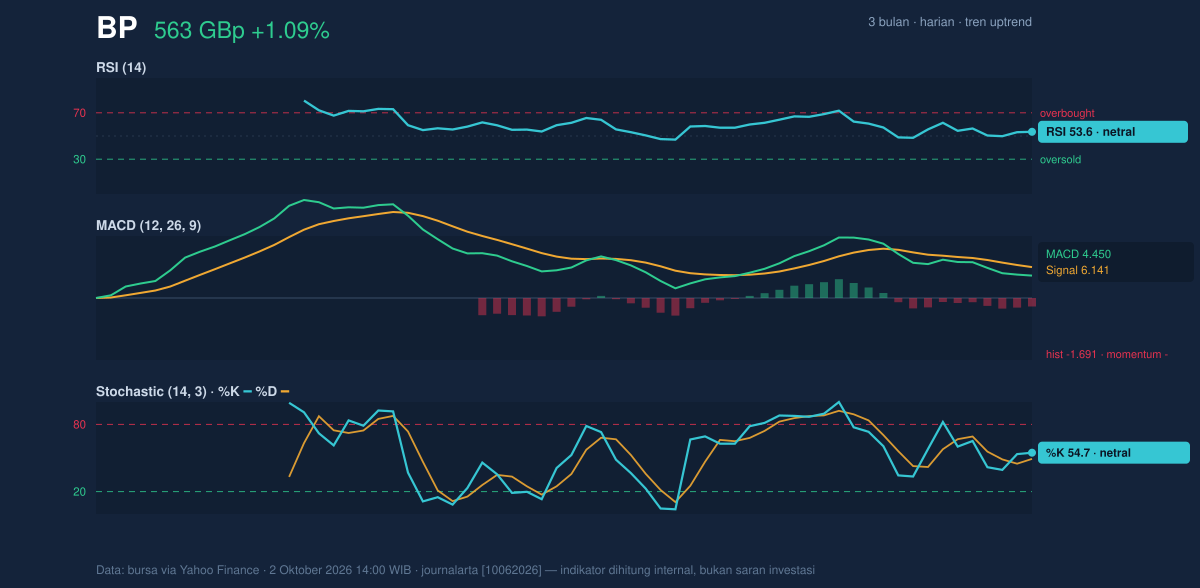
Momentum indicators are mixed rather than broadly confirming the advance. The 14-day Relative Strength Index, or RSI, is 53.6, a neutral reading: it suggests neither unusually strong buying nor an oversold market. The stochastic oscillator, which compares the latest price with its recent trading range, is also neutral, with %K at 54.7 and %D at 49.2.
RSI and Stochastic are neutral, while MACD points to softer momentum. The Moving Average Convergence Divergence (MACD) reading is 4.450, below its 6.141 signal line, leaving a negative histogram of -1.691. In plain terms, the longer-running trend remains up, but the latest upward momentum has weakened. The chart makes that contrast visible.
Volatility & Volume
Trading activity offers little evidence that the latest rise has attracted unusually broad participation. Volume was 29,528,616 shares, about 0.6 times the 20-session average of 47,852,160, while On-Balance Volume (OBV)—a running measure that adds volume on rising days and subtracts it on falling days—was declining. Together, those readings suggest the price gain has not yet been matched by stronger accumulation.
Average True Range (ATR), which estimates typical daily price movement, stands at 15.72 GBp, or 2.8% of the share price. That indicates moderate volatility: moves around the nearby support and resistance could still be material, even without a sharp increase in day-to-day swings.
Key Levels & Scenarios
Resistance is 580.30 GBp; support is 542.30 GBp. A sustained move above resistance would bring the three-month high of 582.60 GBp into focus. Failure to hold support would weaken the current trend structure, particularly if the price also fell below the 20-day average at 558.77 GBp. The lower Bollinger band at 539.34 GBp is another reference point if selling extends beyond support.
Technical Verdict: HOLD (wait & see)
The indicators support a cautious, wait-and-see reading rather than a clear directional signal:
- Trend: Price is above the rising 20-day SMA and the 50-day SMA, supporting the existing uptrend.
- Momentum: Neutral RSI and Stochastic readings are offset by a negative MACD histogram.
- Participation: Below-average volume and falling OBV leave the price advance without strong volume confirmation.
The verdict is invalidated if price falls below 542.30 GBp, the stated 20-session support.
- Ideal Entry Range: 558.77–563.20 GBp, around the 20-day SMA and latest price.
- Exit Target (Target Price): 580.30–582.60 GBp, at resistance and the three-month high.
- Stop Loss: 539.34 GBp, at the lower Bollinger band.
For non-traders, HOLD means the trend is still intact, but the mixed momentum and weak volume leave confirmation uncertain.
Summary Data BP
| Last price | 563.20 GBp |
| Change 1 day / 5 days / 1 month | 1.09% / 0.84% / 4.35% |
| Trend / MA-cross | uptrend / none |
| SMA20 / SMA50 | 558.77 / 543.21 |
| RSI (14) / Stochastic %K | 53.6 / 54.7 |
| Bollinger %B / ATR | 61% / 15.72 |
| Support / Resistance 20 days | 542.30 / 580.30 |
| Data as of | 2 Oktober 2026 14:00 WIB |
Track BP share price daily: live levels, support/resistance and our full BP analysis history.