On Oktober 6, 2026: price 3,631.50 GBp, trend uptrend, RSI 58.4, support 3,482.50, resistance 3,654.50. technical analysis of shell stock.
By Alistair Sterling
October 6, 20264 min read
Shell Stock Technicals Today
Shell plc shares rose 1.18% to 3,631.50 GBp on the London Stock Exchange by 14:00 WIB on 2 October 2026, extending gains over the past month as the price stayed above its short- and medium-term averages. The rise keeps the broader technical picture constructive, but weakening MACD momentum and nearby resistance suggest the advance is meeting a test rather than gathering unqualified strength.
Trend & Price Action
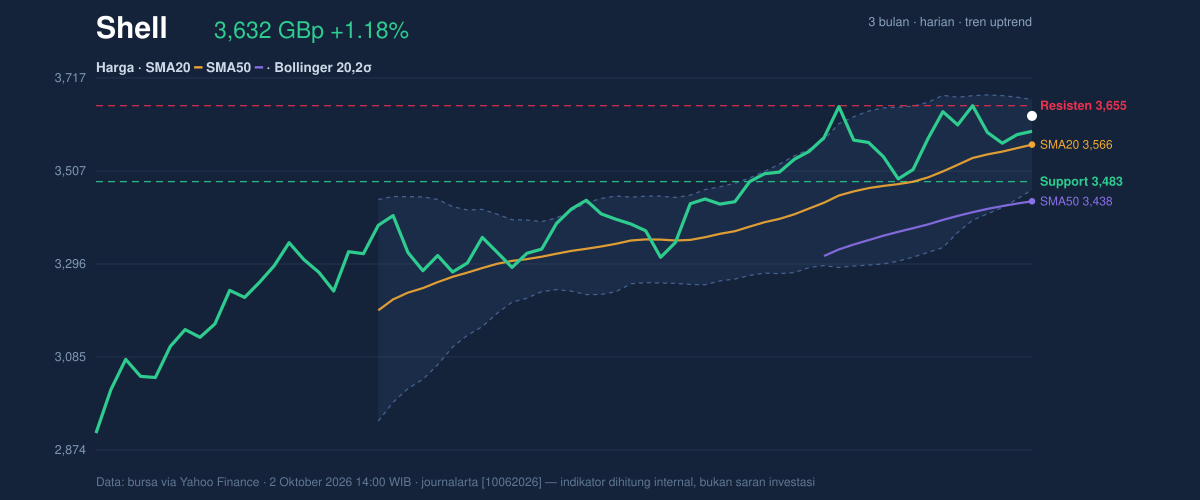
Shell is up 5.66% over one month and 0.57% over five days. Its share price is above the SMA20 at 3,566.30 GBp and the SMA50 at 3,437.90 GBp, while the 20-day average is climbing 1.30% over five days. That combination points to an established upward trend: buyers have maintained prices above both averages, and the shorter-term trend is still rising. There has been no recent moving-average crossover, so the signal comes from price positioning and slope, not a fresh change in trend.
The shares are also close to the 20-session resistance at 3,654.50 GBp and sit at 87% of the recent trading range. The three-month high is 3,681.50 GBp, leaving a relatively narrow gap to the top of that period’s range. Holding above the rising SMA20 supports the uptrend, but proximity to resistance raises the importance of whether the price can sustain a break higher.
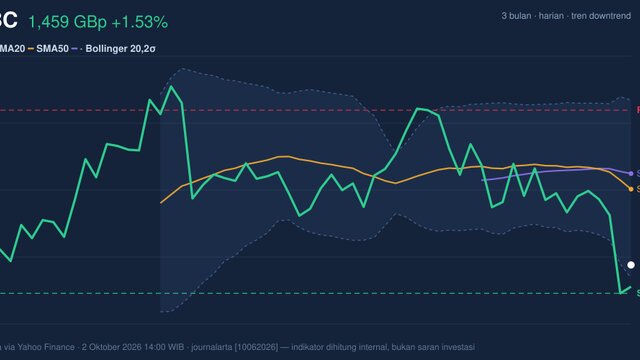
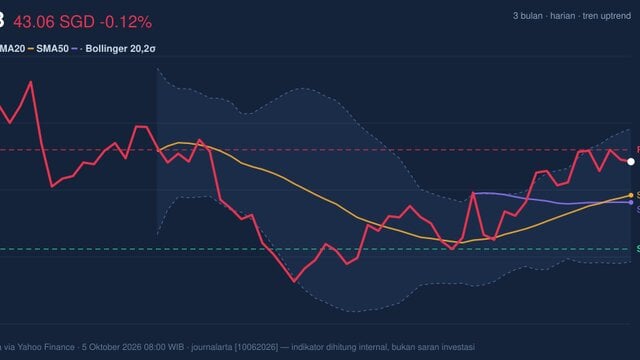
As shown in the chart, the upper Bollinger Band is at 3,668.38 GBp, with the lower band at 3,464.22 GBp.
3-month price action chart of Shell: price, SMA20/50, Bollinger, support & resistance. Data: exchange via Yahoo Finance.
Oscillators & Momentum
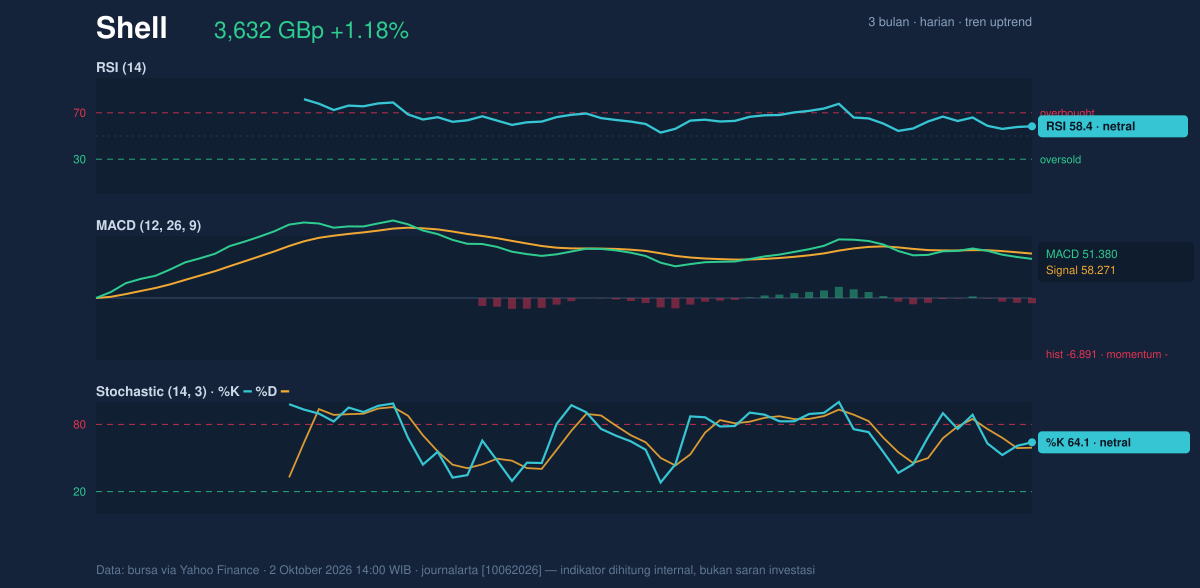
Momentum indicators are mixed rather than strongly confirming the climb. RSI at 58.4 is neutral: it suggests positive but not extreme buying pressure. The Stochastic readings—%K at 64.1 and %D at 59.2—are also neutral, with the faster line above the slower one. Neither measure currently signals an overbought market or a decisive reversal.
MACD offers a more cautious reading. Its value of 51.380 is below the signal line at 58.271, and the histogram is negative at -6.891. This bearish MACD configuration means upward price structure is not being matched by strengthening short-term momentum. It does not by itself overturn the trend, but it makes a sustained push through resistance less certain.
As shown in the momentum chart, the neutral RSI and Stochastic readings contrast with the negative MACD histogram.
Momentum chart of Shell: RSI(14), MACD, Stochastic. Data: exchange via Yahoo Finance.
Volatility & Volume
The Bollinger Band position is elevated but not at the upper boundary: %B is 82%, meaning the price is nearer the top than the bottom of the band. Meanwhile, the 5.7% band width is described as a squeeze, a period of relatively tight price variation that can precede a larger move, though it does not determine the direction. The squeeze makes a breakout possible, not assured; the nearby resistance and fading MACD leave the direction unresolved.
Average True Range, a measure of typical price movement, is 70.27 GBp, or 1.9% of the share price, indicating moderate volatility. Trading volume was 9,527,062 shares, about 0.9 times the 20-day average of 10,053,163. The gain therefore came on below-average participation, while rising On-Balance Volume (OBV)—a cumulative measure that weighs volume alongside price direction—provides some support for the broader advance. The volume evidence is encouraging but not strong enough to confirm a breakout on its own.
Key Levels & Scenarios
The nearest reference points are the 20-session resistance at 3,654.50 GBp and support at 3,482.50 GBp. The price is also close to the upper Bollinger Band at 3,668.38 GBp and the three-month high of 3,681.50 GBp. A sustained move above the resistance area would put the recent high in focus; failure there could leave the shares vulnerable to a pullback toward the rising SMA20 at 3,566.30 GBp. A fall below the 20-session support would weaken the current technical structure.
3-month price action chart of Shell: price, SMA20/50, Bollinger, support & resistance. Data: exchange via Yahoo Finance.
Technical Verdict: HOLD
HOLD (wait & see) fits the balance of evidence: the price remains above rising moving averages, but MACD momentum is negative and the shares are testing resistance on below-average volume. The neutral RSI and Stochastic readings reinforce the case for caution rather than a decisive directional signal.
- Ideal entry range: 3,566.30–3,482.50 GBp, around the SMA20 and 20-session support.
- Exit target (target price): 3,681.50 GBp, the three-month high.
- Stop-loss protection: 3,464.22 GBp, the lower Bollinger Band.
- Invalidation: The verdict is invalidated if the price falls below 3,482.50 GBp, the 20-session support.
For non-traders, the chart still leans upward, but the price is near a ceiling and momentum has not yet confirmed a clear break through it.
Data: Exchange data via Yahoo Finance, as of 2 October 2026, 14:00 WIB. Technical analysis is not an investment recommendation.