Shell Stock Drops 0.82%, Testing Key Resistance In Focus
On September 28, 2026: price 3,611.00 GBp, trend uptrend, RSI 62.5, support 3,344.50, resistance 3,652.50. technical analysis of shell stock.

Shell plc edged lower on the London Stock Exchange on 25 September 2026, with the shares last changing hands at 3,611.00 GBp, down from a previous close of 3,641.00. The move looks modest on the surface, but the chart is telling a more nuanced story: Shell is still in an uptrend, trading above both its SMA20 at 3,520.55 and SMA50 at 3,404.75, even as short-term momentum has started to cool. That combination often means the broader trend remains intact, while traders are becoming more selective near the top of the recent range.
Trend & Price Action
Shell’s structure is still constructive. The shares sit above the 20-day and 50-day moving averages, which usually signals that recent buying pressure has been strong enough to keep the price in the upper half of the trend channel. The SMA20 is rising by 1.38% over 5 days, a useful sign that the trend is not merely flat but still leaning upward. As shown in the chart, price is also trading near the upper end of its 20-hour range, at about 87% of the range, which suggests the market has already done much of the near-term recovery work.
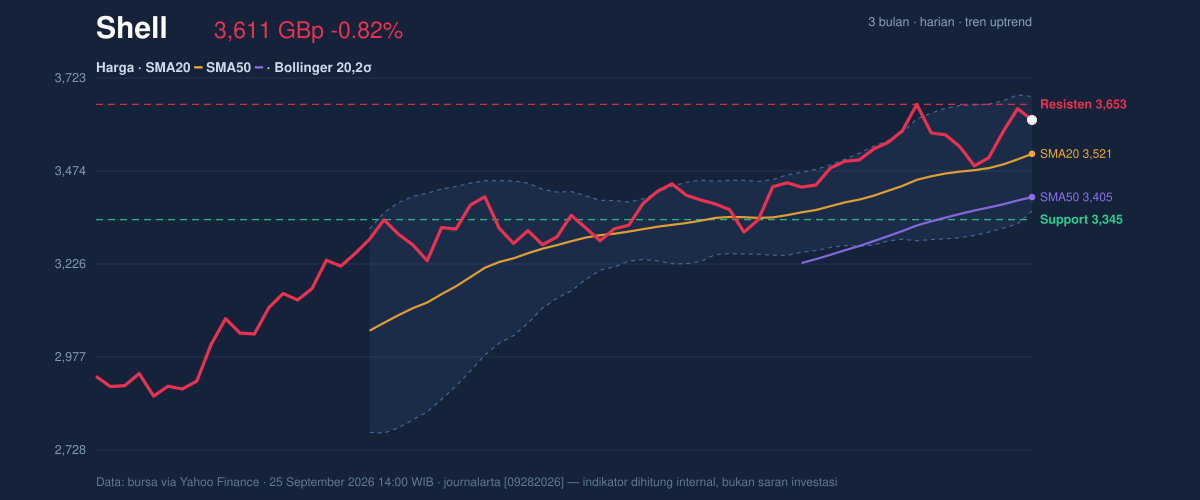
The catch is that Shell is now close to a ceiling rather than a floor. The 20-hour resistance at 3,652.50 sits only a little above the last price, while the nearest 20-hour support at 3,344.50 is materially lower. That gap matters because it shows the stock is no longer in an easy “trend-following” zone; it is pressing against an area where supply has previously appeared. The stock is also just below its 3-month high of 3,663.50, which reinforces the idea that the market is testing the upper boundary of the recent move rather than breaking into fresh territory.
Oscillators & Momentum
Momentum is less convincing than the price trend. The RSI at 62.5 is still neutral, but it is close enough to the upper end of the range to indicate that the shares are no longer cheap on a short-term basis. The Stochastic %K at 76.0 and %D at 78.2 also lean toward the warmer side of neutral, which means the stock has had enough upside that follow-through may need fresh buying interest to continue. As shown in the chart, these oscillators are not flashing a reversal by themselves, but they are warning that the pace of the advance has become stretched relative to the recent base.
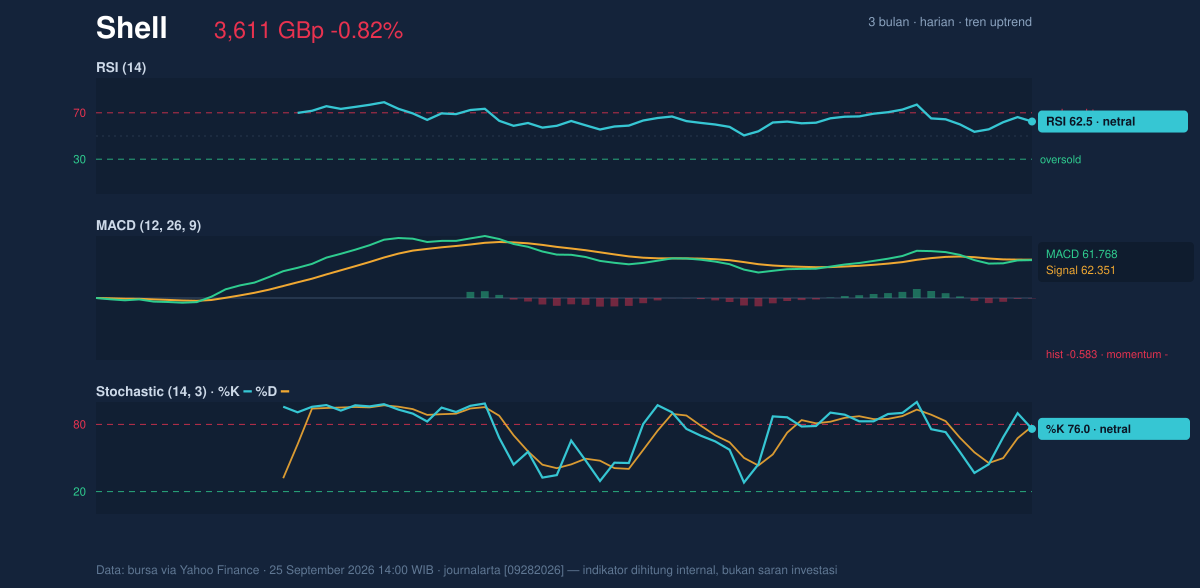
The more important signal is the MACD at 61.768 versus its signal line at 62.351, with a histogram of -0.583. In plain English, that means the short-term trend is still positive, but the latest push has lost some force. A negative histogram does not automatically mean the trend is broken; it means the momentum engine is running a little below the level needed to accelerate. That matters because Shell is trading near resistance, where fading momentum can lead to consolidation rather than immediate breakout.
Volatility & Volume
Volatility is present, but not excessive. The ATR at 66.85, equal to 1.9% of price, points to a market that can still move decisively without being disorderly. The Bollinger Bands are fairly normal in width at 8.7%, which suggests there is no major compression waiting to explode or expansion signaling panic. Price is trading with %B at 80%, meaning it is closer to the upper band than the middle of the range. That usually reflects strength, but it can also mean the easy part of the move has already happened.
Volume adds a more cautious note. Last trade volume of 13,029,960 was about 1.2× normal, so the move is not happening on thin participation. But OBV is falling, which is a subtle warning that the balance of volume has not fully confirmed the recent price tone. In other words, the market is still active, but the underlying accumulation signal is weaker than the headline price action suggests.
Key Levels & Scenarios
The immediate map is fairly clear. The first level to watch is 3,652.50 resistance, then the 3-month high at 3,663.50. A clean move through that zone would tell the market is not just drifting upward, but actually clearing the recent supply area. On the downside, the nearest meaningful reference is 3,520.55, the Bollinger middle band and SMA20, followed by 3,344.50 support if the pullback deepens. Because price is already near the top of the range, a failure to hold the mid-band would be more important than a small one-day dip.
The chart implies a simple conditional setup: if Shell can hold above the SMA20 at 3,520.55 and reclaim 3,652.50, the trend remains in control; if it slips back below the mid-band and loses momentum, the move starts to look more like consolidation than continuation.
Technical Verdict: HOLD (wait & see)
- Reason 1: Price remains above the SMA20 and SMA50, so the broader trend is still upward.
- Reason 2: MACD is below its signal line and the histogram is negative, showing momentum has softened.
- Reason 3: %B at 80% and price near 3,652.50 resistance mean the shares are extended within the recent range.
- Verdict invalidated if price breaks below 3,344.50, the 20-hour support level.
- Ideal Entry Range: 3,520.55 to 3,611.00
- Exit Target: 3,652.50 to 3,663.50
- Stop Loss protection: below 3,344.50
For non-traders, this means Shell still looks technically healthy, but the stock is close to resistance and needs proof before the next move can be trusted.
“Right now, the market is asking Shell to prove it can keep climbing rather than simply hover near the top of the range.”
Summary Data Shell
| Last price | 3,611.00 GBp |
| Change 1 day / 5 days / 1 month | -0.82% / 2.03% / 9.06% |
| Trend / MA-cross | uptrend / none |
| SMA20 / SMA50 | 3,520.55 / 3,404.75 |
| RSI (14) / Stochastic %K | 62.5 / 76.0 |
| Bollinger %B / ATR | 80% / 66.85 |
| Support / Resistance 20 days | 3,344.50 / 3,652.50 |
| Data as of | 25 September 2026 14:00 WIB |


