Testing Key Resistance, Shell Stock Gains 0.37% Today
On September 29, 2026: price 3,654.50 GBp, trend uptrend, RSI 62.6, support 3,344.50, resistance 3,652.50. technical analysis of shell stock.

Shell plc edged higher on the London Stock Exchange to 3,654.50 GBp on 25 September 2026 at 14:00 WIB, extending a short-term climb that has pushed the shares to the top end of their recent trading band. The move looks constructive at first glance, but the chart also shows a market that is already pressing against resistance, with momentum indicators beginning to cool even as the broader trend remains upward.
Trend & Price Action
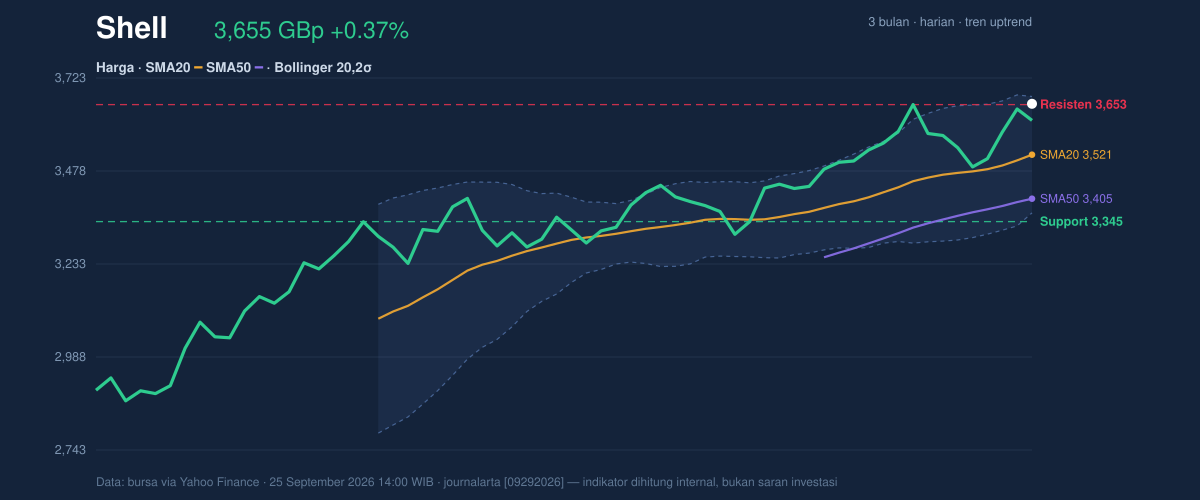
The stock is still trading in an uptrend, and that matters because the price sits above the SMA20 at 3,520.55 and the SMA50 at 3,404.75. In plain English, Shell is holding above both its short- and medium-term trend lines, which usually signals that buyers have kept control over the recent phase. The SMA20 is rising at 1.38% over 5 days, reinforcing that the near-term trend has not rolled over yet.
What makes the setup more nuanced is where the shares are trading within the range. The price is at 101% of the 20-hour range, with resistance at 3,652.50 and a nearby upper Bollinger band at 3,673.81, as shown in the chart. That positioning suggests Shell is no longer in a comfortable mid-range advance; it is now leaning into a ceiling where further gains may need fresh buying interest to continue. The stock is also close to its 3-month high of 3,663.50, which often attracts profit-taking if momentum fails to confirm the breakout.
Oscillators & Momentum
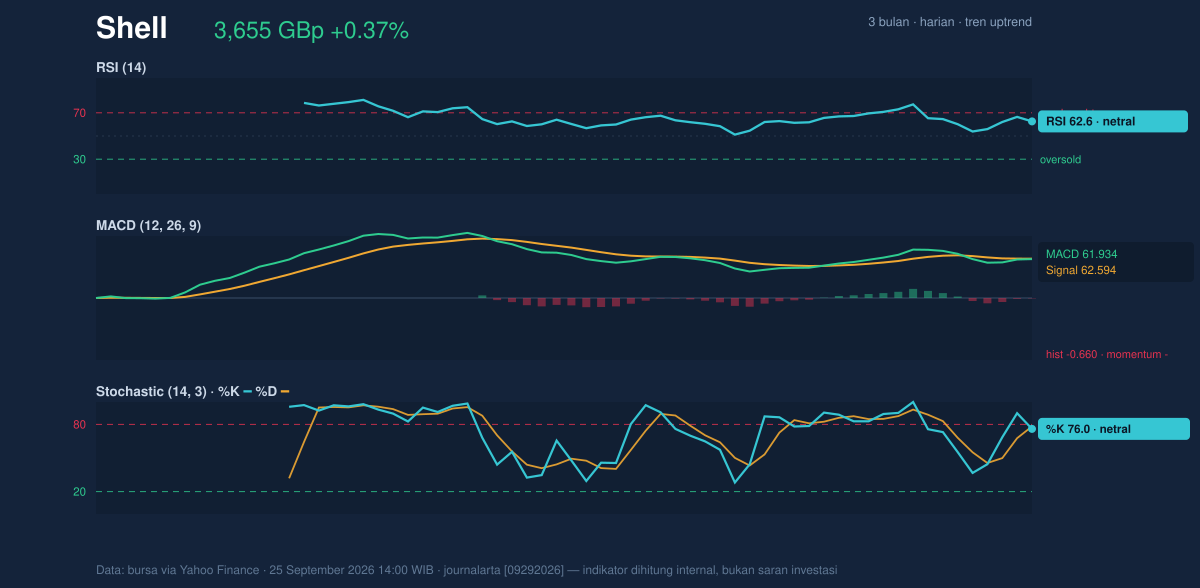
The momentum picture is less decisive than the trend picture. RSI at 62.6 is still neutral, but it is high enough to show the shares are no longer in an early-stage rebound; the market has already done much of the work. The Stochastic %K at 76.0 and %D at 78.2 are also neutral, yet they sit in the upper part of the scale, which usually means the stock is stretched but not necessarily exhausted.
The more important warning comes from MACD. MACD at 61.934 sits below the signal line at 62.594, leaving a histogram of -0.660. That negative histogram means the recent pace of gains is slowing even though the broader trend remains positive. In market terms, this is not a reversal signal on its own, but it does show that the advance is losing some internal force. As shown in the chart, the oscillators are not confirming the price’s push toward the highs with the same conviction.
Volatility & Volume
Volatility is moderate rather than explosive. The ATR(14) at 66.85, equal to 1.8% of price, implies Shell can still move meaningfully in either direction, but not in a disorderly way. The Bollinger band structure is also telling: the %B at 94% means the price is trading very near the top of the band, which often reflects strength — but also leaves less room before the move starts to look extended. The 8.7% band width is normal, so this is not a squeeze setup that typically precedes a sharp volatility burst; instead, it looks like a market already traveling near the upper edge of its recent envelope.
Volume adds a mixed message. Last volume of 13,029,960 was about 1.2× normal versus the 20-hour average of 11,208,195, so participation is healthy enough to support the latest advance. Yet OBV is falling, and that is the more subtle concern. OBV, or on-balance volume, tracks whether trading flow is accumulating into strength or leaking away during rallies. A falling OBV while price rises can suggest that the move is not being broadly confirmed, which makes the breakout attempt less robust than the headline price action suggests.
Key Levels & Scenarios
The immediate line in the sand is clear. Resistance at 3,652.50 is being tested now, while the next visible ceiling sits near the 3-month high of 3,663.50 and the upper Bollinger band at 3,673.81. If Shell can hold above resistance, the chart would start to look like a continuation rather than a stall. If it fails, the shares could drift back toward the SMA20 at 3,520.55, which is the first meaningful support area and also the Bollinger midline.
Below that, the next structural support is the SMA50 at 3,404.75, followed by the 20-hour support at 3,344.50. That lower level matters because it sits well beneath the current price and would imply that the recent breakout attempt has lost traction. In a market already near the top of its range, the difference between a clean hold and a failed push is often the difference between consolidation and a sharper retracement.
Technical Verdict: HOLD (wait & see)
Shell’s chart still leans positive, but the balance between trend and momentum is no longer clean enough for a stronger technical call. HOLD (wait & see) fits best because the price remains above the SMA20 and SMA50, yet MACD is negative, OBV is falling, and the shares are already pressing against resistance at 3,652.50 with %B at 94%. That combination says the trend is intact, but confirmation is weak.
- Ideal Entry Range: near 3,520.55 to 3,404.75, where the SMA20 and SMA50 sit as support.
- Exit Target: 3,663.50 to 3,673.81, using the 3-month high and upper Bollinger band as the next technical reference zone.
- Stop Loss protection: below 3,344.50, where the 20-hour support would be broken and the recent structure would weaken materially.
- Verdict invalidated if price breaks below 3,344.50.
In plain English, Shell is still trending higher, but the chart is asking for proof that the latest push can hold. “You can feel the market hesitating right under the ceiling,” one London trader said.
Summary Data Shell
| Last price | 3,654.50 GBp |
| Change 1 day / 5 days / 1 month | 0.37% / 3.26% / 10.37% |
| Trend / MA-cross | uptrend / none |
| SMA20 / SMA50 | 3,520.55 / 3,404.75 |
| RSI (14) / Stochastic %K | 62.6 / 76.0 |
| Bollinger %B / ATR | 94% / 66.85 |
| Support / Resistance 20 days | 3,344.50 / 3,652.50 |
| Data as of | 25 September 2026 14:00 WIB |



