CSX Stock on Monday: Little Changed, Up 3.1% in Five Sessions
Technical analysis of CSX stock on November 16, 2026: price 52.03 USD, trend uptrend, RSI 58.4, support 48.08, resistance 52.40.
Why CSX is in focus today
Selected automatically from 8 NASDAQ (US) stocks by a technical-signal score with daily weighted randomisation — not a recommendation.
Trend & Price Action
CSX traded above its 20-day simple moving average (SMA) of $51.15 and its 50-day average of $49.04. The 20-day average rose 1.81% over five days, a sign that recent price strength is being reflected in the average rather than appearing only as a brief spike. The 20-day average is also above the 50-day, though no new moving-average cross formed in the latest session. At $52.03, the stock was at 91% of its 20-day range between support at $48.08 and resistance at $52.40. That position leaves limited room to the nearer resistance before the shares would need to establish a higher trading area. The three-month high of $52.90 is another reference point; the three-month low was $45.79. As shown in the chart, CSX sits above its rising short-term average, but close to the upper end of its recent range.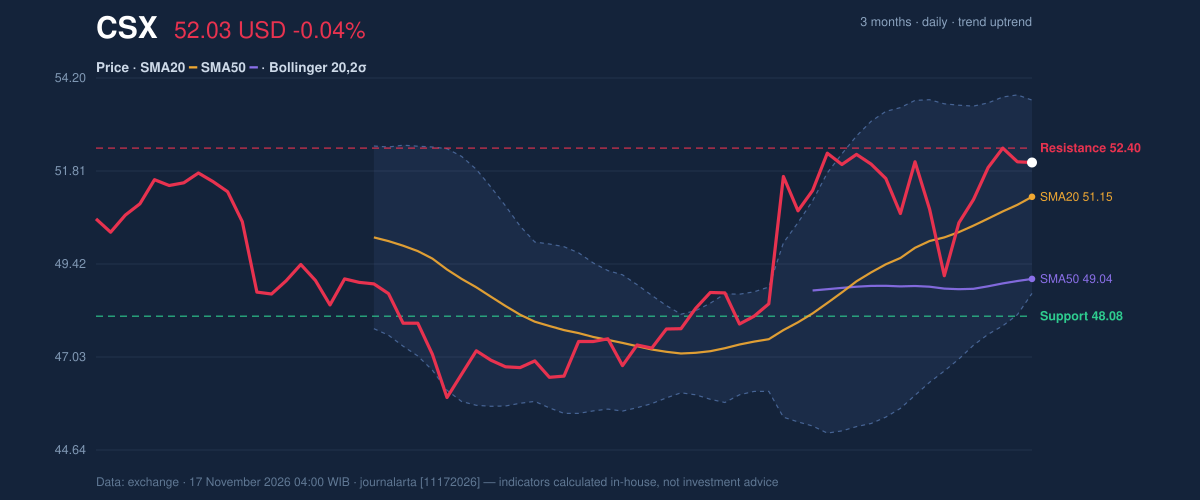
Oscillators & Momentum
The indicators are positive without showing an extreme reading. The RSI is 58.4, a neutral reading on a scale commonly used to gauge whether a stock may be overbought or oversold. That leaves room for momentum to strengthen, while offering no strong signal that the latest advance has become stretched. The Stochastic %K at 77.3 and %D at 80.7 are also neutral. The two readings sit close together, so the indicator does not yet show a decisive shift in short-term momentum. MACD offers firmer confirmation: the MACD is 0.776 versus a 0.756 signal line, with a positive 0.020 histogram. The histogram has just turned positive, meaning the MACD line is marginally above its signal line and momentum has tilted upward.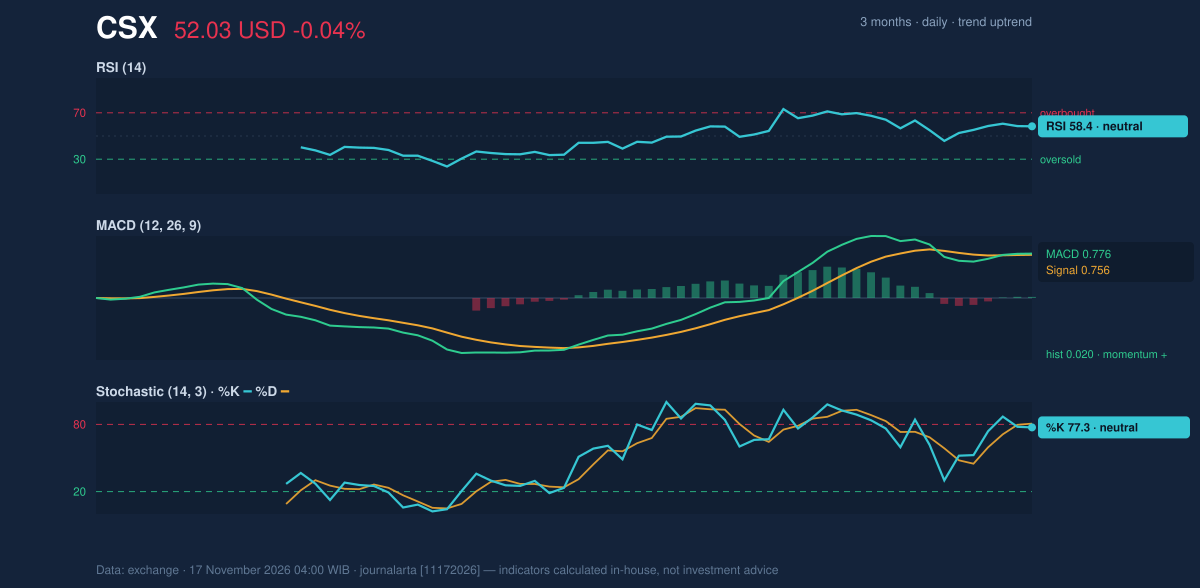
Volatility & Volume
The Bollinger Bands are at $48.67 on the lower edge, $51.15 in the middle and $53.63 on the upper edge. With %B at 68% and band width at 9.7%, the price is in the upper portion of a band that remains at normal width—not a squeeze that signals unusually compressed trading, nor a sharp expansion suggesting volatility has surged. The 14-day ATR, a measure of typical price movement, is $1.21, or 2.3% of the share price, indicating moderate volatility. Volume was 9,945,300 shares, about 0.8 times the 20-day average of 12,953,025, while OBV declined. That combination tempers the price signals: the advance has not been accompanied by above-average trading participation, and the falling OBV suggests buying pressure has not been consistently confirmed by volume.Key Levels & Scenarios
The nearest test is resistance at $52.40, followed by the three-month high at $52.90. A move through those levels would indicate that the recent range is giving way; failure to clear them could leave CSX trading between resistance and the rising 20-day average at $51.15. Support at $48.08 marks the lower boundary of the cited 20-day range, while the 50-day average at $49.04 offers a separate trend reference.Fundamental Context
According to its SEC filing, CSX reported quarterly revenue of $4.02 billion for the quarter ended September 30, 2026, up 12.0% from $3.59 billion a year earlier. Net income was $1.05 billion, compared with $694.0 million a year earlier, and diluted earnings per share were $0.57. Those results provide operating context, while the verdict below is based on the technical signals.Technical Verdict: BUY
The JournalArta Research verdict is BUY, supported by the uptrend, CSX’s position above its 50-day average, and two bullish signals against no bearish ones. The newly positive MACD histogram and the pullback toward the 20-day average within an uptrend reinforce that reading. The main caution is weaker participation: volume was 0.8 times its 20-day average and OBV fell. - Ideal entry range: $51.13–$52.03 - Exit targets: $55.12 (target 1) and $58.21 (target 2) - Stop-loss protection: $49.97 - Reward/risk: 1.5 to target 1 and 3.0 to target 2 - Validity: through December 15, 2026 The verdict would be invalidated if CSX falls below $49.97. In plain English, the technical setup is positive while the shares hold within the stated risk limits.Summary Data CSX
| Last price | 52.03 USD |
| Change 1 day / 5 days / 1 month | -0.04% / 3.07% / 8.67% |
| Trend / MA-cross | uptrend / none |
| SMA20 / SMA50 | 51.15 / 49.04 |
| RSI (14) / Stochastic %K | 58.4 / 77.3 |
| Bollinger %B / ATR | 68% / 1.21 |
| Support / Resistance 20 days | 48.08 / 52.40 |
| Data as of | 17 November 2026 04:00 WIB |
| JournalArta research verdict (score) | Buy (+84) |
| Entry zone | 51.13 – 52.03 |
| Target 1 / 2 | 55.12 / 58.21 |
| Stop loss | 49.97 |
| Reward/risk | 1.5 / 3.0 |
Disclaimer: This technical analysis is generated automatically from exchange data and indicators calculated by JournalArta, for information and education only. The verdict and the entry, target and stop-loss levels are not investment advice or a solicitation to buy or sell any security. Investment decisions and their risks rest solely with the reader.
Track CSX stock price daily: live levels, support/resistance and our full CSX analysis history.
 Take the quizWhat Kind of Holiday Spender Are You? Take the Black Friday QuizStart →
Most Read
- 1U.S. Emergency Alert Test Nov. 17 Is Not a Power Outage

- 2Women With Autoimmune Diseases Wait About 4 Years for Diagnosis, Study Finds

- 3DUP Chairman Lord Morrow Loses Wife and Daughter Within Hours in NI

- 4Micron Stock Falls 28% as $35.16 Billion Buyback Nears

- 5I’m A Celebrity 2026 Line-Up: Rooney Leads 11 Stars Into Jungle

Don't Miss
 Lifestyle7 Signs Your Social Battery Is Running Low (and Why You Keep Cancelling Plans)
 Lifestyle · Food & HealthThanksgiving Food Safety: How Long Leftovers Last and the Safe Turkey Temperature
 Lifestyle7 Quiet Habits of Emotionally Intelligent People, According to Psychologists
 LifestylePeople Who Don’t Like Celebrating Their Birthday Often Share These 7 Traits