Paychex (PAYX) Stock Rises 1.81%: Up 2.6% in Five Sessions
Technical analysis of PAYX stock on November 16, 2026: price 117.77 USD, trend uptrend, RSI 59.2, support 108.21, resistance 119.50.
Why PAYX is in focus today
Selected automatically from 8 NASDAQ (US) stocks by a technical-signal score with daily weighted randomisation — not a recommendation.
Trend & Price Action
Paychex traded above both its 20-day simple moving average (SMA), at $114.90, and its 50-day average, at $110.88. The 20-day average rose 1.43% over five days, reinforcing the uptrend rather than merely reflecting a single strong session. The 20-day average is also above the 50-day average, but the data show no new moving-average crossover in the latest session. The stock sits at 85% of its 20-day range, with resistance at $119.50 and support at $108.21. That position signals strength, but also means the price has less room before reaching the near-term ceiling. The three-month range, from $98.00 to $127.98, puts the current price between the recent low and high rather than at an extreme. The Bollinger Bands, which measure how far price has moved from its recent average, span $108.52 to $121.28. At 72% of the band range, PAYX is in the upper half without yet touching the upper band; the normal 11.1% width indicates volatility has not compressed into an unusually tight range or expanded sharply. As shown in the chart, the moving averages, bands and price levels frame a rising trend that is now testing resistance.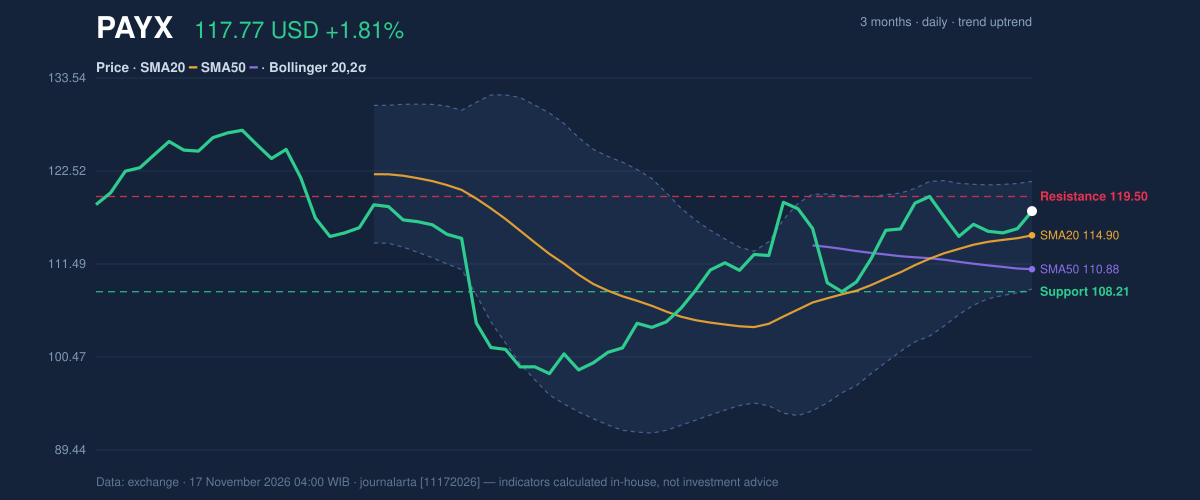
Oscillators & Momentum
Momentum indicators support the advance but do not show an overheated market. The RSI is neutral at 59.2; the Relative Strength Index gauges the pace of recent gains and losses, and this reading is consistent with positive momentum without an extreme condition. The Stochastic is also neutral, with %K at 69.1 and %D at 59.4, showing recent price strength but no reported overbought signal. The MACD line is 1.683 against a 1.586 signal line, leaving a positive histogram of 0.097. This means the trend-following momentum measure remains on the constructive side, although the narrow gap between the lines argues against treating it as an acceleration signal on its own.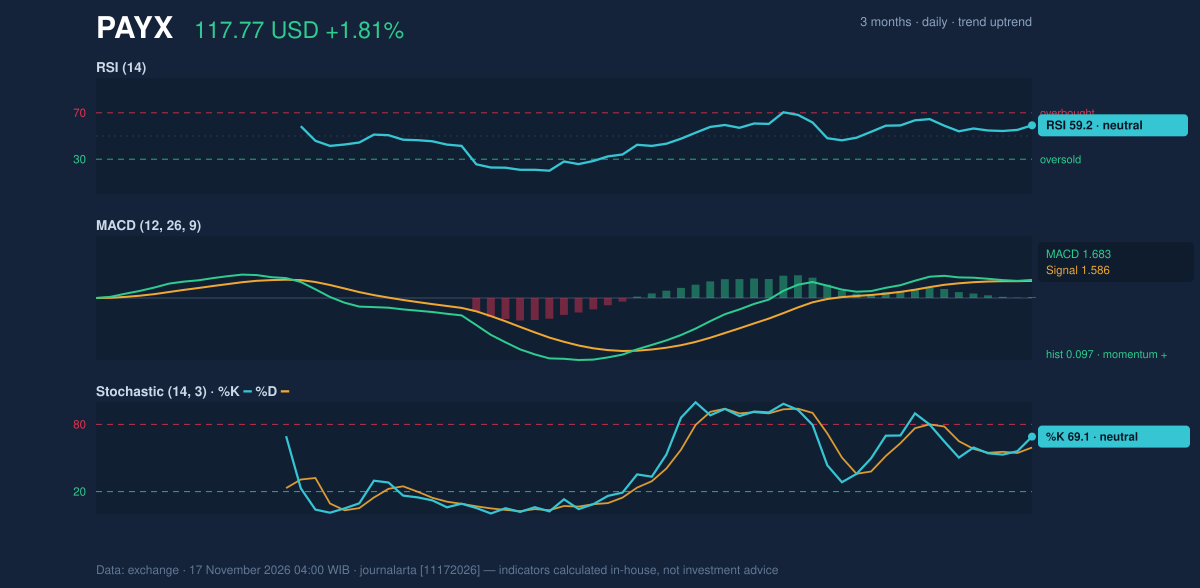
Volatility, Volume & Levels
Volume reached 3,190,400 shares, or 1.1 times the 20-day average of 2,838,890. The excess is modest, but it matters because a rising price accompanied by above-average turnover is more broadly supported than a move on thin trading. On-balance volume (OBV), which tracks whether volume is accumulating on up days or down days, is rising as well—another confirmation of participation. Average True Range, a measure of typical price movement, stands at $3.23, equivalent to 2.7% of the share price. That points to moderate daily volatility: the stock can move meaningfully around key levels, so a brief test of resistance or support would not alone establish a trend reversal. A sustained move above $119.50 would put the recent resistance under pressure, while failure to hold the $114.90 20-day average would weaken the short-term structure. The wider 20-day support at $108.21 is a more substantial level to monitor if the pullback deepens. These are conditional reference points, not forecasts.Fundamental Context
According to its SEC filing, Paychex reported quarterly revenue of $1.58 billion for the quarter ended 2026-08-31, up 5.9% from $1.49 billion a year earlier. Net income was $429.7 million, compared with $383.8 million a year earlier, and diluted earnings per share were $1.21. The filing provides a business-performance backdrop to the chart, while the verdict below is based on technical signals.Technical Verdict: BUY
JournalArta Research’s computed verdict is BUY, with a score of +84 on a −100 to +100 scale. The strongest technical reasons are that PAYX is above its 50-day average, its 20-day average is above the 50-day average, and the broader trend is rising. The two bullish signals—an uptrend pullback near the SMA20 while remaining above the SMA50, and rising OBV—are unopposed by bearish signals in the supplied data. The RSI and Stochastic readings remain neutral, while resistance at $119.50 and moderate ATR are risks to watch. The verdict is invalidated if price falls below $112.28.- Entry range: $115.35–$117.77
- Exit targets: $126.00 (target 1) and $134.24 (target 2)
- Stop-loss protection: $112.28
Summary Data PAYX
| Last price | 117.77 USD |
| Change 1 day / 5 days / 1 month | 1.81% / 2.62% / 6.34% |
| Trend / MA-cross | uptrend / none |
| SMA20 / SMA50 | 114.90 / 110.88 |
| RSI (14) / Stochastic %K | 59.2 / 69.1 |
| Bollinger %B / ATR | 72% / 3.23 |
| Support / Resistance 20 days | 108.21 / 119.50 |
| Data as of | 17 November 2026 04:00 WIB |
| JournalArta research verdict (score) | Buy (+84) |
| Entry zone | 115.35 – 117.77 |
| Target 1 / 2 | 126.00 / 134.24 |
| Stop loss | 112.28 |
| Reward/risk | 1.5 / 3.0 |
Today's full Buy and Sell list for US stocks →
Disclaimer: This technical analysis is generated automatically from exchange data and indicators calculated by JournalArta, for information and education only. The verdict and the entry, target and stop-loss levels are not investment advice or a solicitation to buy or sell any security. Investment decisions and their risks rest solely with the reader.
Track PAYX stock price daily: live levels, support/resistance and our full PAYX analysis history.
 Take the quizWhat Kind of Holiday Spender Are You? Take the Black Friday QuizStart →
- 1U.S. Emergency Alert Test Nov. 17 Is Not a Power Outage

- 2Women With Autoimmune Diseases Wait About 4 Years for Diagnosis, Study Finds

- 3DUP Chairman Lord Morrow Loses Wife and Daughter Within Hours in NI

- 4Micron Stock Falls 28% as $35.16 Billion Buyback Nears

- 5I’m A Celebrity 2026 Line-Up: Rooney Leads 11 Stars Into Jungle

 Lifestyle7 Signs Your Social Battery Is Running Low (and Why You Keep Cancelling Plans)
 Lifestyle · Food & HealthThanksgiving Food Safety: How Long Leftovers Last and the Safe Turkey Temperature
 Lifestyle7 Quiet Habits of Emotionally Intelligent People, According to Psychologists
 LifestylePeople Who Don’t Like Celebrating Their Birthday Often Share These 7 Traits