J Sainsbury Share Price on Monday: Rises 1.05%, Up 1.2% in Five Sessions
Technical analysis of Sainsbury's stock on November 16, 2026: price 356.60 GBp, trend sideways, RSI 58.3, support 338.20, resistance 360.00.
Why Sainsbury's is in focus today
Selected automatically from 7 LSE (UK) stocks by a technical-signal score with daily weighted randomisation — not a recommendation.
Trend & Price Action
The shares were 1.19% higher over five days but down 0.61% over one month, a mixed record consistent with a sideways trend. At 356.60 GBp, the price sat above the SMA20 at 350.90 GBp and SMA50 at 342.07 GBp. The 20-day average rose 0.13% over five days, while the 20-day average remained above the 50-day average; no new moving-average cross formed in the latest session. Together, those readings show a modestly constructive price structure, without a fresh trend signal. The shares were at 84% of their 20-session range, closer to resistance at 360.00 GBp than support at 338.20 GBp. The three-month high of 363.50 GBp is also nearby. That positioning leaves less room before the next visible barrier, even as the averages beneath the price provide potential reference points for support. The chart shows price alongside the moving averages, Bollinger bands and key levels: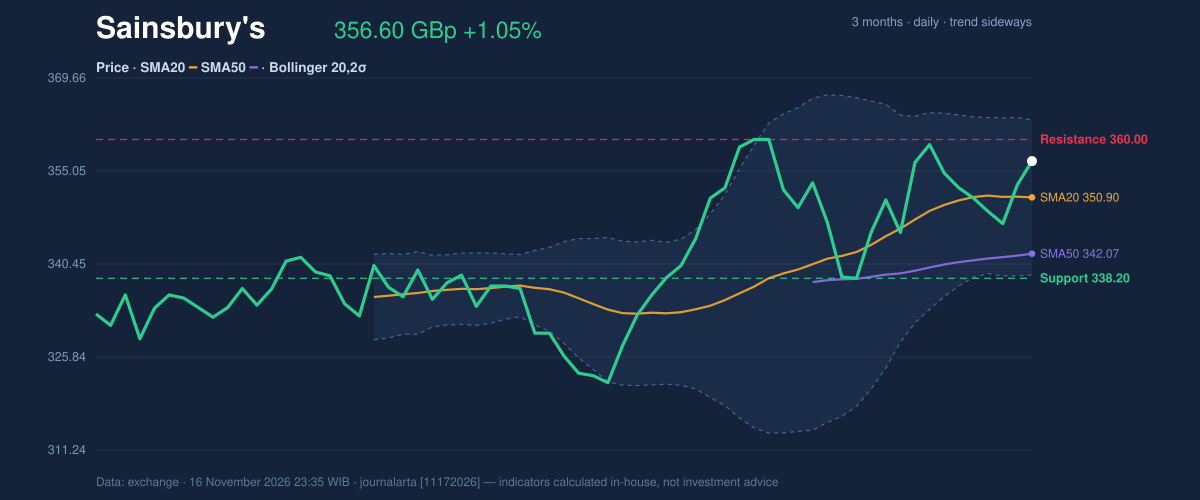
Oscillators & Momentum
The RSI stood at 58.3, in neutral territory, while the Stochastic reading was 75.6 for %K and 57.6 for %D, also classified as neutral. These indicators do not show an oversold rebound or an overbought extreme. They suggest the recent rise has not yet pushed momentum to either boundary. MACD offers a more cautious signal: at 2.972, it was below its 3.156 signal line, leaving a negative histogram of -0.184. That gap indicates weakening momentum despite the price holding above its averages. A stronger move through resistance would carry more weight if MACD also turned upward. The momentum chart displays RSI, MACD and Stochastic: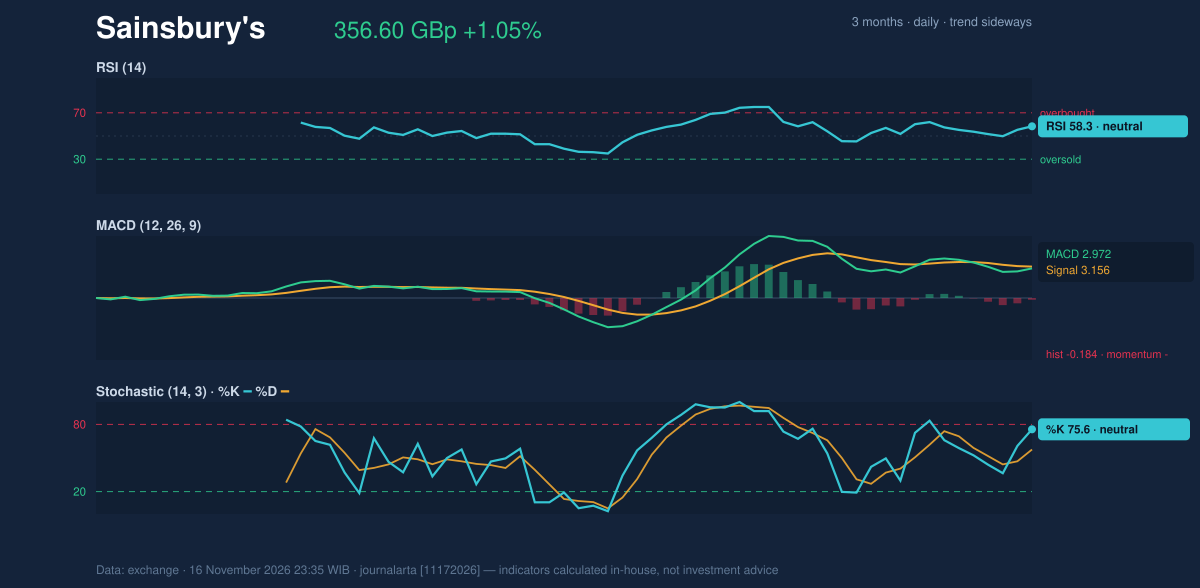
Volatility & Volume
The Bollinger band width was 6.9%, and the bands were narrowing—a squeeze that can precede a larger move but does not identify its direction. The price’s %B reading of 73% placed it in the upper part of the band, between the midpoint at 350.90 GBp and the upper band at 363.08 GBp. The squeeze raises the possibility of a breakout, while the upper-band position makes resistance especially relevant. ATR was 7.63 GBp, or 2.1% of the share price, indicating moderate recent price variation. Volume of 7,394,204 shares was 0.8 times the 20-session average of 8,703,936, and OBV was falling. That combination points to limited participation and does not confirm that buyers are accumulating shares.Key Levels & Scenarios
A sustained move above 360.00 GBp would put the three-month high of 363.50 GBp and the upper Bollinger band at 363.08 GBp in focus. Holding above those nearby reference points would strengthen the case that the narrowing bands are resolving upward. If the shares fail at resistance, the SMA20 at 350.90 GBp is an initial reference below the current price; the 20-session support at 338.20 GBp is a deeper level to watch. A break below that support would weaken the constructive reading from the moving averages.Technical Verdict: BUY
JournalArta Research assigns Sainsbury’s a BUY verdict, with a score of +66 on its -100 to +100 scale. The strongest supporting signals are the share price above its 50-day average, the 20-day average above the 50-day, and RSI at 58.3 in the 50–70 zone. The pullback-to-SMA20 signal is bullish under the stated uptrend condition, although the negative MACD histogram and falling OBV remain risks. The verdict is invalidated if the price falls below the specified stop-loss level. - Entry range: 350.88–356.60 GBp - Exit targets: 376.07 GBp (target 1) and 395.54 GBp (target 2) - Stop loss: 343.62 GBp - Validity: through December 14, 2026 In plain English, the verdict reflects a constructive trend setup whose momentum and trading volume have yet to fully confirm it.Summary Data Sainsbury's
| Last price | 356.60 GBp |
| Change 1 day / 5 days / 1 month | 1.05% / 1.19% / -0.61% |
| Trend / MA-cross | sideways / none |
| SMA20 / SMA50 | 350.90 / 342.07 |
| RSI (14) / Stochastic %K | 58.3 / 75.6 |
| Bollinger %B / ATR | 73% / 7.63 |
| Support / Resistance 20 days | 338.20 / 360.00 |
| Data as of | 16 November 2026 23:35 WIB |
| JournalArta research verdict (score) | Buy (+66) |
| Entry zone | 350.88 – 356.60 |
| Target 1 / 2 | 376.07 / 395.54 |
| Stop loss | 343.62 |
| Reward/risk | 1.5 / 3.0 |
Today's full Buy and Sell list for UK, Singapore & Hong Kong stocks →
Disclaimer: This technical analysis is generated automatically from exchange data and indicators calculated by JournalArta, for information and education only. The verdict and the entry, target and stop-loss levels are not investment advice or a solicitation to buy or sell any security. Investment decisions and their risks rest solely with the reader.
Track Sainsbury's share price daily: live levels, support/resistance and our full Sainsbury's analysis history.
 Take the quizWhat Kind of Holiday Spender Are You? Take the Black Friday QuizStart →
- 1Women With Autoimmune Diseases Wait About 4 Years for Diagnosis, Study Finds

- 2Micron Stock Falls 28% as $35.16 Billion Buyback Nears

- 3I’m A Celebrity 2026 Line-Up: Rooney Leads 11 Stars Into Jungle

- 4Taylor Swift and the Falcons Game Today: Chiefs in Atlanta

- 5Actor Says David Walliams Sexually Humiliated Him on Stage

 Lifestyle7 Signs Your Social Battery Is Running Low (and Why You Keep Cancelling Plans)
 Lifestyle · Food & HealthThanksgiving Food Safety: How Long Leftovers Last and the Safe Turkey Temperature
 Lifestyle7 Quiet Habits of Emotionally Intelligent People, According to Psychologists
 LifestylePeople Who Don’t Like Celebrating Their Birthday Often Share These 7 Traits