Legal & General Share Price Slides 2.96% (November 16, 2026): Trading Volume 2.3x Normal
Technical analysis of Legal & General stock on November 16, 2026: price 305.40 GBp, trend sideways, RSI 52.0, support 298.20, resistance 314.70.

Why Legal & General is in focus today
- One-day move of 0.00%, about 0.0× its average daily range (ATR)
- Volume at 0.0× the 20-day average
Selected automatically from 7 LSE (UK) stocks by a technical-signal score with daily weighted randomisation — not a recommendation.
Trend & Price Action
The short-term picture is sideways: the last price was marginally below the 20-day average of 305.52 GBp, but above the 50-day average of 297.79 GBp. The 20-day average rose 1.28% over five days, and the longer average remains below it. That arrangement preserves a constructive medium-term structure, though the latest close does not confirm a renewed short-term advance. No new moving-average cross formed. The stock fell 0.94% over five days but gained 2.66% over one month. It sits at 44% of its 20-day range, between support at 298.20 GBp and resistance at 314.70 GBp. The three-month range runs from 282.78 GBp to 316.80 GBp, putting the upper boundary close to the near-term resistance zone. As shown in the chart, the price is hovering around its 20-day average, with the 50-day average below it and nearby resistance above.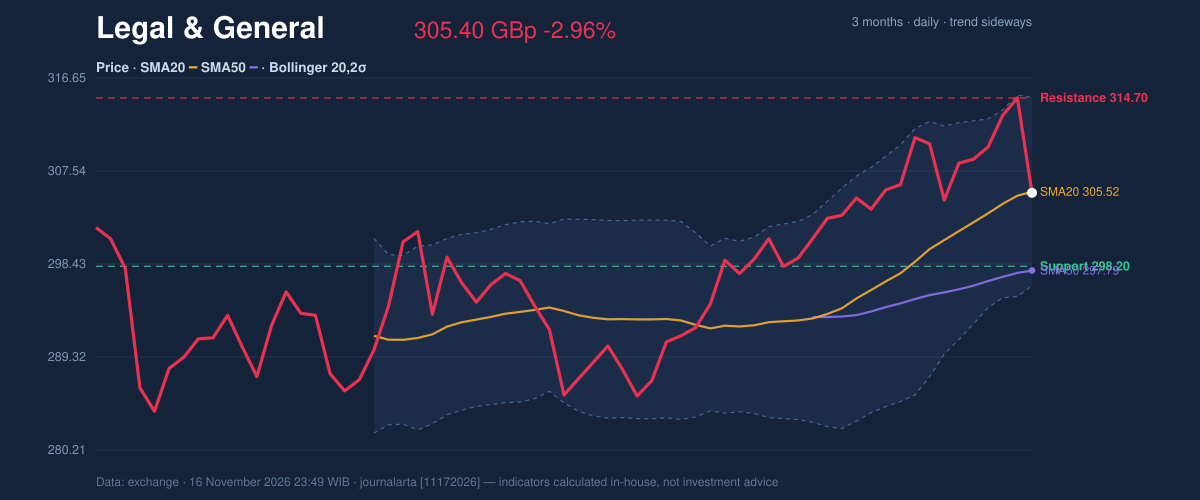
Oscillators & Momentum
Momentum readings do not point in one direction. The RSI is 52.0, a neutral reading that places the shares in neither an overbought nor oversold zone. The Stochastic reading is also neutral, with %K at 30.1 and %D at 68.7; the gap between the two lines signals weaker near-term momentum, even without a decisive oversold reading. By contrast, MACD is positive at 3.863, above its 3.780 signal line, and its histogram is positive at 0.083. MACD compares shorter- and longer-term price averages to gauge momentum; its positive reading suggests the recent underlying trend still has some upward force. That signal is modest beside the day’s decline and the soft five-day performance. The chart puts these measures together: RSI is near the middle of its scale, Stochastic is lagging, and MACD remains just above its signal line.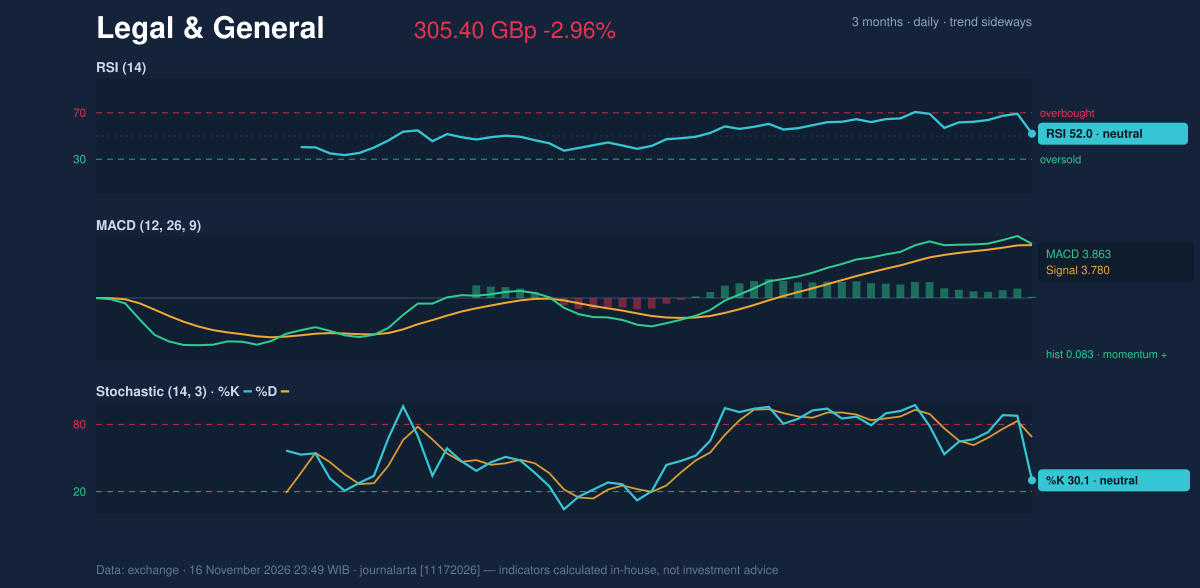
Volatility & Volume
The Bollinger Bands are narrowing, a squeeze that can precede a larger move but does not identify its direction. The band width is 6.0%, with the price near the middle band at 305.52 GBp and %B at 49%. The upper and lower bands stand at 314.75 GBp and 296.28 GBp, respectively. The session’s volume of 36,448,706 shares was 2.3 times the 20-day average of 16,157,842, while OBV rose. OBV tracks whether volume tends to accompany rising or falling prices; its rise suggests some accumulation over the measured period. Yet turnover surged on a down day, so it is not clean confirmation of buying strength. ATR, a measure of typical price movement, was 5.17 GBp, or 1.7% of the share price, indicating moderate volatility.Key Levels & Scenarios
A close above 314.70 GBp, the 20-day resistance, would put the shares through a level that also sits near the three-month high of 316.80 GBp. A break would strengthen the case that the narrowing bands are resolving upward. If the price instead falls below 298.20 GBp, the 20-day support, the pullback would threaten the structure above the 50-day average. The data also places the price-minus-1.5-ATR level at 297.65 GBp, close to that support.Technical Verdict: HOLD (wait & see)
HOLD (wait & see) fits the mixed evidence: the price remains above its 50-day average and the 20-day average is higher than the 50-day, while RSI is neutral and MACD is positive. Against that, the shares slipped over five days and turnover was unusually high on a down day. The verdict is invalidated if price breaks below 298.20 GBp support. - Entry range: 314.70 GBp to 316.80 GBp, conditional on a close above 20-day resistance. - Exit target: 316.80 GBp, the three-month high, in that upside scenario. - Stop-loss protection: 298.20 GBp, the 20-day support; a break below it defines the downside scenario. In plain English, the trend has some support, but the conflicting momentum signals leave direction unconfirmed. | Indicator | Reading | |---|---:| | Last price | 305.40 GBp | | Change | 1 day −2.96% · 5 days −0.94% · 1 month +2.66% | | SMA20 / SMA50 | 305.52 / 297.79 GBp | | RSI / Stochastic | 52.0 / %K 30.1, %D 68.7 | | MACD / signal / histogram | 3.863 / 3.780 / 0.083 | | Bollinger Bands | 314.75 / 305.52 / 296.28 GBp | | Support / resistance | 298.20 / 314.70 GBp | | Three-month high / low | 316.80 / 282.78 GBp |Summary Data Legal & General
| Last price | 305.40 GBp |
| Change 1 day / 5 days / 1 month | -2.96% / -0.94% / 2.66% |
| Trend / MA-cross | sideways / none |
| SMA20 / SMA50 | 305.52 / 297.79 |
| RSI (14) / Stochastic %K | 52.0 / 30.1 |
| Bollinger %B / ATR | 49% / 5.17 |
| Support / Resistance 20 days | 298.20 / 314.70 |
| Data as of | 16 November 2026 23:49 WIB |
| JournalArta research verdict (score) | Hold (+43) |
Today's full Buy and Sell list for UK, Singapore & Hong Kong stocks →
Disclaimer: This technical analysis is generated automatically from exchange data and indicators calculated by JournalArta, for information and education only. The verdict and the entry, target and stop-loss levels are not investment advice or a solicitation to buy or sell any security. Investment decisions and their risks rest solely with the reader.
Track Legal & General share price daily: live levels, support/resistance and our full Legal & General analysis history.
 Take the quizWhat Kind of Holiday Spender Are You? Take the Black Friday QuizStart →
- 1Women With Autoimmune Diseases Wait About 4 Years for Diagnosis, Study Finds

- 2Micron Stock Falls 28% as $35.16 Billion Buyback Nears

- 3I’m A Celebrity 2026 Line-Up: Rooney Leads 11 Stars Into Jungle

- 4Taylor Swift and the Falcons Game Today: Chiefs in Atlanta

- 5Actor Says David Walliams Sexually Humiliated Him on Stage

 Lifestyle7 Signs Your Social Battery Is Running Low (and Why You Keep Cancelling Plans)
 Lifestyle · Food & HealthThanksgiving Food Safety: How Long Leftovers Last and the Safe Turkey Temperature
 Lifestyle7 Quiet Habits of Emotionally Intelligent People, According to Psychologists
 LifestylePeople Who Don’t Like Celebrating Their Birthday Often Share These 7 Traits