The Lottery Share Price Update: Rises 0.73%, Up 3% in a Month
Technical analysis of The Lottery Corporation stock on November 16, 2026: price 5.51 AUD, trend uptrend, RSI 63.8, support 5.28, resistance 5.57.
Why The Lottery Corporation is in focus today
Selected automatically from 6 ASX (Australia) stocks by a technical-signal score with daily weighted randomisation — not a recommendation.
Trend & Price Action
TLC gained 0.73% over five days and 2.99% over one month. Its 20-day average stands at A$5.42, above the 50-day average at A$5.13, with the share price above both. The 20-day average rose 1.03% over five days, reinforcing the upward trend. No new moving-average cross was recorded in the latest session; the existing alignment supports the trend but is not a fresh signal. The share sits at 79% of its 20-day range, between support at A$5.28 and resistance at A$5.57. It is also close to its three-month high of A$5.61. That position leaves less room before nearby resistance, so a continued rise would need to clear that area rather than merely hold the trend averages. As shown in the chart, TLC is approaching the upper end of its recent trading range while remaining above its moving averages.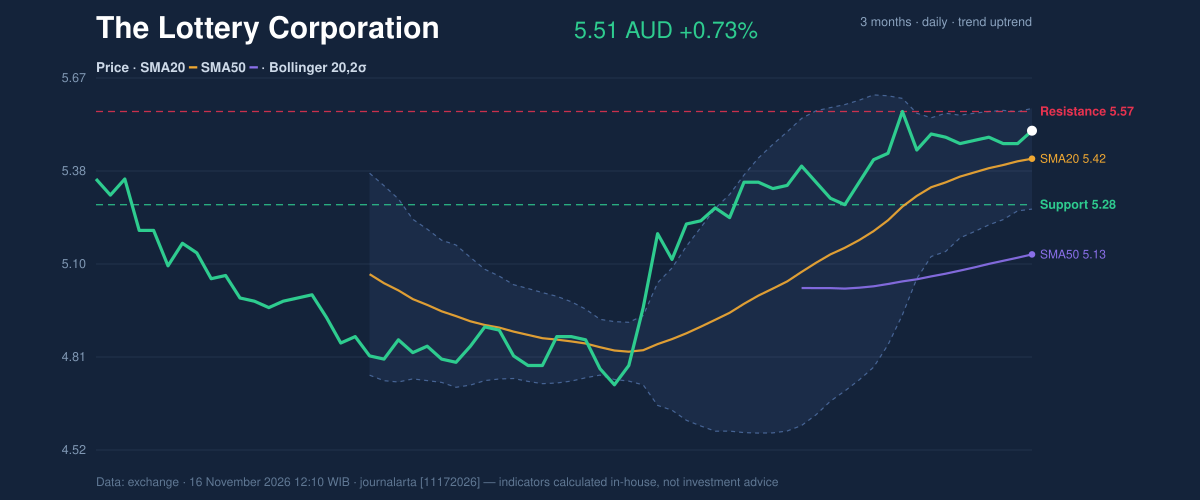
Oscillators & Momentum
The RSI at 63.8 is neutral, within the 50–70 zone cited by JournalArta’s research signal. That reading is consistent with an upward trend, without showing an extreme condition. The Stochastic readings, %K at 71.4 and %D at 63.8, are also neutral, offering no clear reversal signal. MACD gives a more cautious reading: the histogram is negative at −0.010, with MACD at 0.097 below its 0.107 signal line. This points to weakening short-term momentum even as the broader trend remains positive. The indicators therefore tell a mixed story: trend measures are constructive, but momentum has not confirmed a renewed burst of strength. The chart brings these momentum readings together.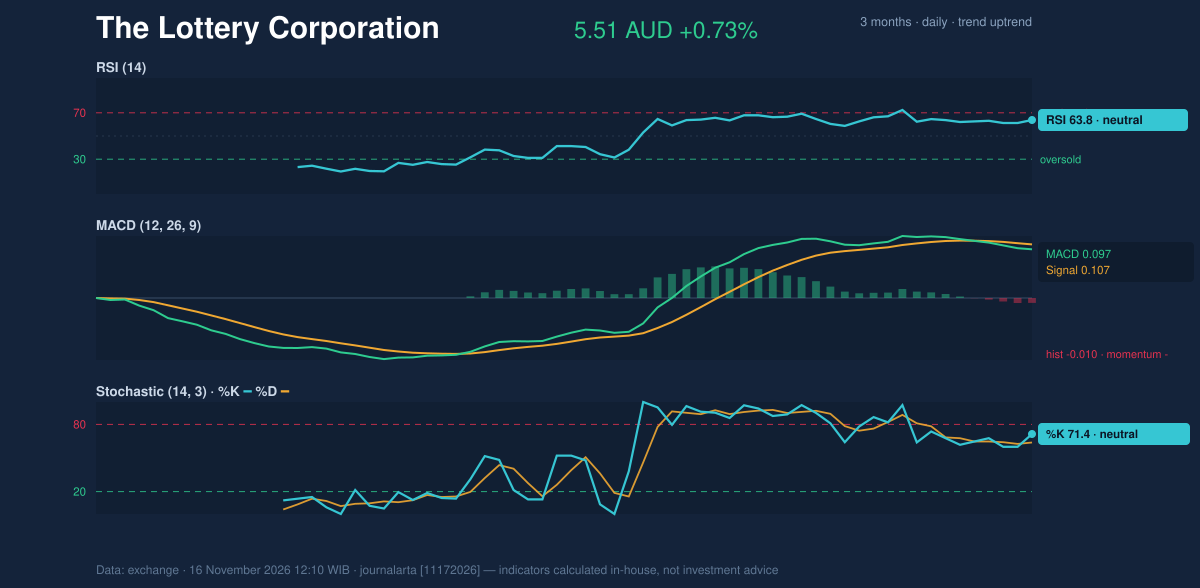
Volatility & Volume
The Bollinger bands are narrowing, with a width of 5.8%. A squeeze means recent price movement has become more contained and can precede a larger move, but it does not determine the direction. TLC’s %B reading of 78% places it in the upper part of the band, near the upper boundary of A$5.58. That makes the nearby resistance at A$5.57 especially relevant: a move through it would test whether the range is resolving upward. Average True Range is A$0.10, or 1.8% of the share price, indicating moderate volatility. However, the latest volume of 5,744,772 shares was only 0.6 times the 20-day average of 9,183,629, while OBV fell. OBV tracks whether volume tends to accompany rising or falling prices; its decline alongside light turnover suggests limited confirmation from trading activity.Key Levels & Scenarios
Resistance at A$5.57 is the immediate test, with the three-month high at A$5.61 nearby. A sustained break above that area would strengthen the case that the narrowing bands are resolving higher. If the price fails there, support at A$5.28 is the first level to watch; the lower Bollinger band is A$5.27. A deeper pullback would put the 20-day average at A$5.42 in focus before that support zone.Technical Verdict: BUY
JournalArta’s technical model assigns TLC a score of +76 on a −100 to +100 scale. The verdict is supported by the share price above its 50-day average, the 20-day average above the 50-day average, and the uptrend with RSI at 63.8. The counter-signals are the negative MACD histogram, falling OBV and below-average volume. The verdict is invalidated if the price falls below A$5.25. - Entry range: A$5.44–A$5.51 - Exit targets: A$5.90 and A$6.29 - Stop-loss protection: A$5.25 - Reward/risk: 1.5 / 3.0 - Valid until: December 14, 2026 In plain English, the model’s positive reading depends on TLC holding its upward trend despite weaker short-term momentum and trading participation. The research signal remains valid through December 14, 2026.Summary Data The Lottery Corporation
| Last price | 5.51 AUD |
| Change 1 day / 5 days / 1 month | 0.73% / 0.73% / 2.99% |
| Trend / MA-cross | uptrend / none |
| SMA20 / SMA50 | 5.42 / 5.13 |
| RSI (14) / Stochastic %K | 63.8 / 71.4 |
| Bollinger %B / ATR | 78% / 0.10 |
| Support / Resistance 20 days | 5.28 / 5.57 |
| Data as of | 16 November 2026 12:10 WIB |
| JournalArta research verdict (score) | Buy (+76) |
| Entry zone | 5.44 – 5.51 |
| Target 1 / 2 | 5.90 / 6.29 |
| Stop loss | 5.25 |
| Reward/risk | 1.5 / 3.0 |
Today's full Buy and Sell list for Australian stocks (ASX) →
Disclaimer: This technical analysis is generated automatically from exchange data and indicators calculated by JournalArta, for information and education only. The verdict and the entry, target and stop-loss levels are not investment advice or a solicitation to buy or sell any security. Investment decisions and their risks rest solely with the reader.
Track The Lottery Corporation share price daily: live levels, support/resistance and our full The Lottery Corporation analysis history.
 Take the quizWhat Kind of Holiday Spender Are You? Take the Black Friday QuizStart →





 Lifestyle7 Signs Your Social Battery Is Running Low (and Why You Keep Cancelling Plans)
 Lifestyle · Food & HealthThanksgiving Food Safety: How Long Leftovers Last and the Safe Turkey Temperature
 Lifestyle7 Quiet Habits of Emotionally Intelligent People, According to Psychologists
 LifestylePeople Who Don’t Like Celebrating Their Birthday Often Share These 7 Traits