STJ Share Price Rises 0.17% (November 16, 2026): Up 10.4% in a Month
Technical analysis of STJ stock on November 16, 2026: price 1,174.50 GBp, trend uptrend, RSI 65.8, support 1,040.00, resistance 1,174.50.

Why STJ is in focus today
Selected automatically from 7 LSE (UK) stocks by a technical-signal score with daily weighted randomisation — not a recommendation.
Trend & Price Action
STJ is trading above its 20-day simple moving average of 1,114.53 and its 50-day average of 1,090.40. The 20-day average rose 2.55% over five days, a sign that the recent advance is being reflected in the trend measure itself. A golden cross formed four sessions before the latest session, when the 20-day average moved above the 50-day. It points to improving intermediate momentum, though it is not a guarantee that gains will continue. The share price sits at the upper boundary of its 20-day range: 1,174.50 GBp resistance, against support at 1,040.00 GBp. It remains below the three-month high of 1,212.16, leaving room before that longer-period test. As shown in the chart, price is nearing the upper Bollinger band while both moving averages slope upward.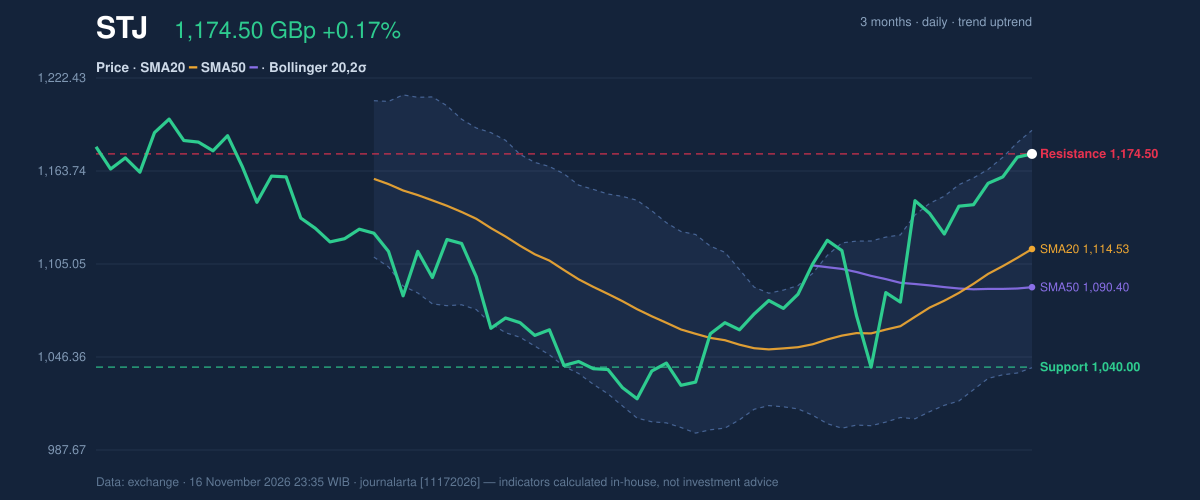
Oscillators & Momentum
The indicators show a rising market, though they differ on how extended it has become. RSI is 65.8, in neutral territory, while the MACD is positive at 23.451 against a 15.257 signal line, with a positive 8.194 histogram. MACD compares two moving averages to gauge momentum; its position above the signal line supports the uptrend reading. Stochastic is overbought at 93.3 for %K and 92.2 for %D. That reading can occur during a strong advance, but it also means the price may be vulnerable to a pause or pullback. RSI has not reached the same extreme, so the signals suggest short-term heat rather than a confirmed reversal.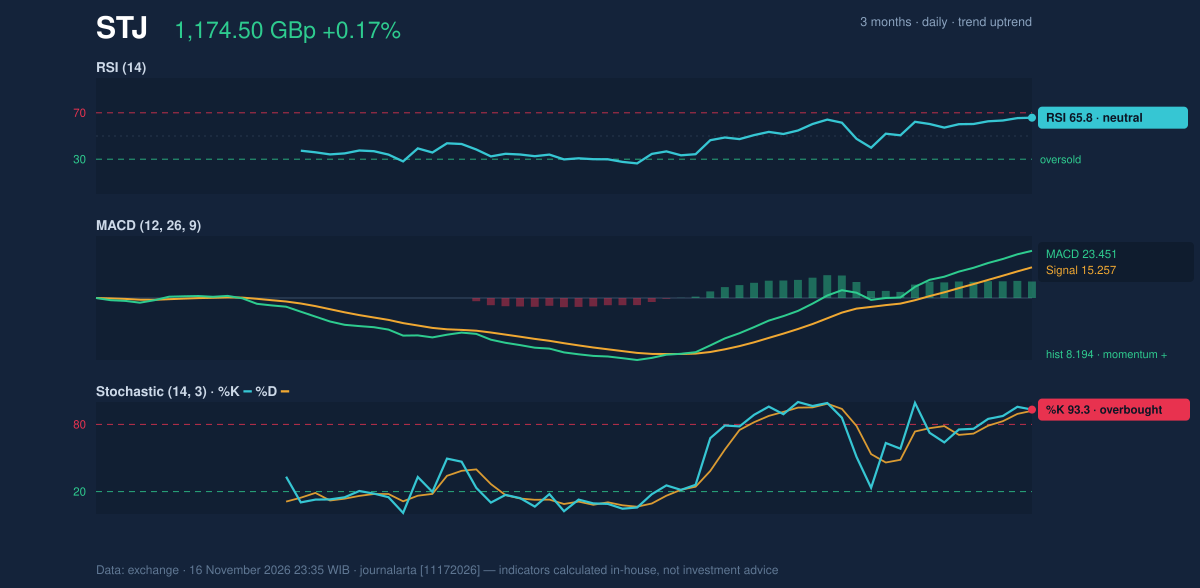
Volatility & Volume
The 20-day Bollinger bands are at 1,039.60 and 1,189.45, with the price near the upper band at 90% of the range. Band width is 13.4%, described as normal, so the data do not point to an unusually tight squeeze or a sharp volatility expansion. ATR is 39.39 GBp, or 3.4% of the share price, indicating moderate recent price movement. Volume was 890,145 shares, about 0.6 times the 20-day average of 1,401,136. The rise in OBV, a running measure that combines price direction and trading volume, suggests buying participation has accumulated over time. But below-average turnover in the latest session means the price’s approach to resistance has not been accompanied by unusually strong trading.Technical Verdict: BUY
The required technical verdict is BUY. It is supported by price above the 50-day average, the upward 20-day/50-day golden cross, and an uptrend confirmed by rising OBV. The main caution is the overbought Stochastic reading, alongside price at 100% of its 20-day range. The verdict is invalidated if price falls below 1,107.61 GBp. - Ideal entry range: 1,145.00–1,174.50 GBp - Exit targets: 1,274.83 GBp (target 1); 1,375.17 GBp (target 2) - Stop-loss protection: 1,107.61 GBp - Validity: Through December 14, 2026; stated reward-to-risk ratios are 1.5 and 3.0. For non-traders, the indicators favor further gains, but the short-term signals warn that the price could pause before continuing higher.| Indicator | Reading |
|---|---|
| Last price | 1,174.50 GBp |
| Change | 1 day: 0.17%; 5 days: 2.89%; 1 month: 10.44% |
| SMA20 / SMA50 | 1,114.53 / 1,090.40 |
| Golden cross | Formed four sessions before the latest session |
| RSI / Stochastic | 65.8 neutral / 93.3 and 92.2 overbought |
| MACD / signal / histogram | 23.451 / 15.257 / 8.194 |
| Bollinger upper / middle / lower | 1,189.45 / 1,114.53 / 1,039.60 |
| ATR | 39.39 GBp; 3.4% of price |
| Volume / 20-day average | 890,145 / 1,401,136 |
| Support / resistance | 1,040.00 / 1,174.50 GBp |
| Three-month high / low | 1,212.16 / 1,011.50 GBp |
Summary Data STJ
| Last price | 1,174.50 GBp |
| Change 1 day / 5 days / 1 month | 0.17% / 2.89% / 10.44% |
| Trend / MA-cross | uptrend / golden |
| SMA20 / SMA50 | 1,114.53 / 1,090.40 |
| RSI (14) / Stochastic %K | 65.8 / 93.3 |
| Bollinger %B / ATR | 90% / 39.39 |
| Support / Resistance 20 days | 1,040.00 / 1,174.50 |
| Data as of | 16 November 2026 23:35 WIB |
| JournalArta research verdict (score) | Buy (+76) |
| Entry zone | 1,145.00 – 1,174.50 |
| Target 1 / 2 | 1,274.83 / 1,375.17 |
| Stop loss | 1,107.61 |
| Reward/risk | 1.5 / 3.0 |
Today's full Buy and Sell list for UK, Singapore & Hong Kong stocks →
Disclaimer: This technical analysis is generated automatically from exchange data and indicators calculated by JournalArta, for information and education only. The verdict and the entry, target and stop-loss levels are not investment advice or a solicitation to buy or sell any security. Investment decisions and their risks rest solely with the reader.
 Take the quizWhat Kind of Holiday Spender Are You? Take the Black Friday QuizStart →
Most Read
- 1Women With Autoimmune Diseases Wait About 4 Years for Diagnosis, Study Finds

- 2Micron Stock Falls 28% as $35.16 Billion Buyback Nears

- 3I’m A Celebrity 2026 Line-Up: Rooney Leads 11 Stars Into Jungle

- 4Taylor Swift and the Falcons Game Today: Chiefs in Atlanta

- 5Actor Says David Walliams Sexually Humiliated Him on Stage

Don't Miss
 Lifestyle7 Signs Your Social Battery Is Running Low (and Why You Keep Cancelling Plans)
 Lifestyle · Food & HealthThanksgiving Food Safety: How Long Leftovers Last and the Safe Turkey Temperature
 Lifestyle7 Quiet Habits of Emotionally Intelligent People, According to Psychologists
 LifestylePeople Who Don’t Like Celebrating Their Birthday Often Share These 7 Traits