Shell Stock Gains 2.86%, RSI Overbought In Focus
On September 16, 2026: price 3,652.50 GBp, trend uptrend, RSI 72.1, support 3,311.00, resistance 3,582.00. technical analysis of shell stock.

Shell plc edged higher on the London Stock Exchange on 14 September 2026, with Shell’s last price at 3,652.50 GBp after a 2.86% daily rise, pushing the shares beyond the upper Bollinger band and into fresh near-term high ground. The move is technically constructive, but it also carries a warning: momentum is strong enough to keep the uptrend alive, yet stretched enough that the market is now paying a premium relative to recent trading bands.
Trend & Price Action
The broad picture remains positive. Shell is trading above SMA20 at 3,434.73 and above SMA50 at 3,313.92, which means the shorter trend is still leading the medium-term trend and the share price is holding above both of its main moving-average reference points. That is the classic shape of an established uptrend, especially when the SMA20 slope is rising at 1.61% over 5 days; in plain English, the trend line itself is still climbing rather than flattening out.
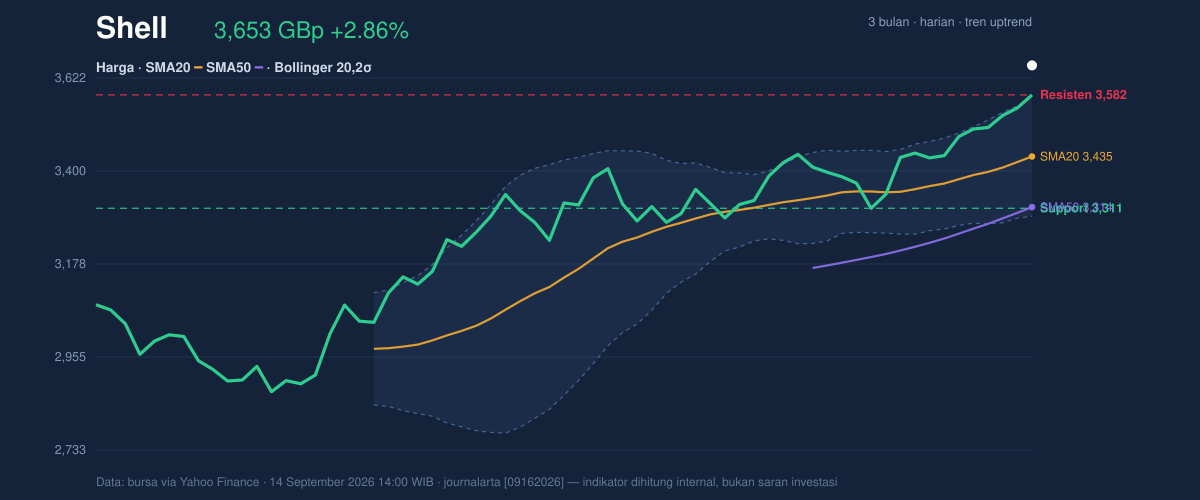
As shown in the chart, Shell is also trading above the upper Bollinger band at 3,577.37, with %B at 126%. That reading matters because it shows the stock has moved beyond the normal envelope of recent prices, not just to the edge of it. In technical terms, that often signals strong demand, but it can also imply short-term overheating if the move extends too far without a pause. The 20-hour support at 3,311.00 remains the key floor to watch, while 20-hour resistance at 3,582.00 has effectively been tested and overtaken by the current price. The shares now sit near the top of the 3-month range between 2,559.50 and 3,612.00, which underlines how far the rebound has travelled.
Oscillators & Momentum
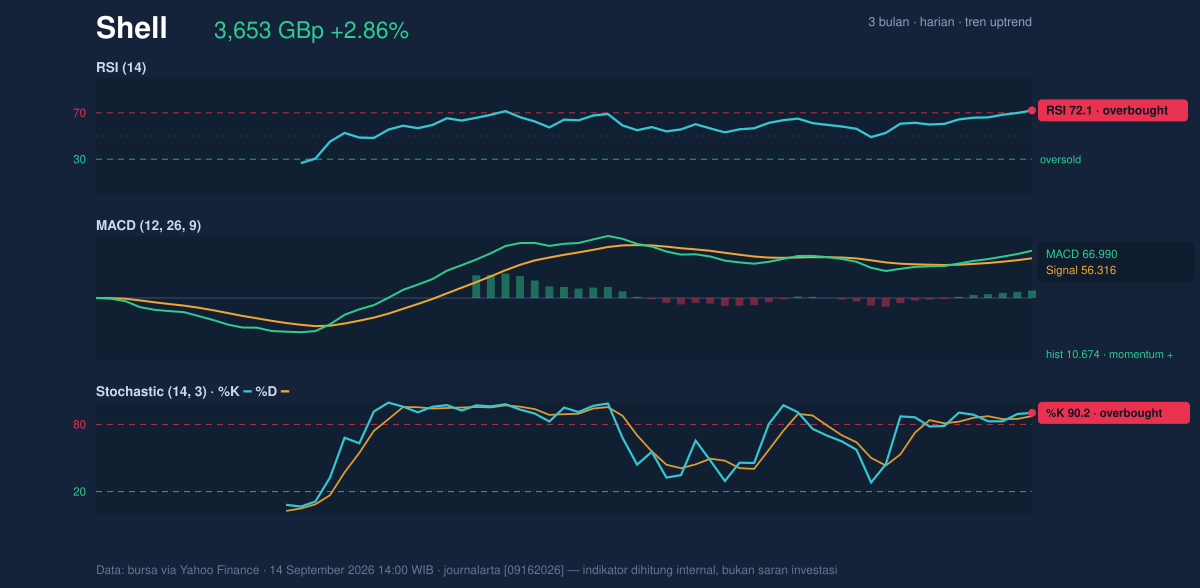
The momentum stack is firmly positive, but not comfortable. RSI at 72.1 and Stochastic %K at 90.2 versus %D at 87.4 both point to overbought conditions. That does not mean the rally must reverse immediately; it means the shares have risen fast enough that further gains may need stronger follow-through to avoid a pause. This is where the signal becomes nuanced: overbought readings in a strong uptrend often reflect momentum, not failure, but they also raise the odds of consolidation if fresh buyers do not keep arriving.
The MACD picture is more supportive. MACD at 66.990 remains above the signal line at 56.316, with a positive histogram of 10.674. That combination means trend momentum is still expanding rather than fading. In practical terms, MACD is saying the rally has not yet run out of steam, even if RSI and Stochastic are warning that the move is extended in the short term. The tension between these indicators is important: momentum is bullish, but the oscillators are no longer offering a comfortable entry zone.
Volatility & Volume
Volatility is present, but not extreme. ATR at 59.04, or 1.6% of price, points to moderate daily movement. That suggests Shell can still travel meaningfully in either direction, but the tape is not showing disorderly swings. The Bollinger band width of 8.3% is described as normal, which is notable because the price is already pressing above the upper band; in other words, the move is energetic, but the market has not yet entered a full volatility expansion regime.
Volume, however, adds a note of caution. The latest turnover of 6,393,781 shares is only 0.6x the 20-day average of 10,420,323. That means the advance has not been backed by unusually heavy participation on this reading. The OBV is rising, so the longer-running volume trend still supports accumulation, but today’s lighter tape suggests the breakout is not being chased aggressively. In a market like this, that can mean two things: either the move is being absorbed calmly by holders, or it may need a stronger volume response to sustain itself above resistance.
Key Levels & Scenarios
The immediate technical map is fairly clear. 3,582.00 is the first reference point on the upside, and the current price at 3,652.50 GBp is already beyond it. If Shell can hold above that area, the market is effectively confirming that the upper band breakout is being accepted rather than rejected. If the shares slip back under that zone, the move starts to look more like an exhaustion spike than a clean continuation.
On the downside, 3,434.73 matters because it is both the SMA20 and the Bollinger middle band, making it the first meaningful trend gauge. A break below that level would signal that the price is losing its short-term momentum cushion. The deeper line in the sand is 3,311.00, the 20-hour support. If that fails, the bullish structure would weaken materially because the price would be back inside the prior trading range and closer to the lower volatility band at 3,292.08.
Technical Verdict: HOLD (wait & see)
HOLD (wait & see) fits the current setup best because the trend is still rising, but the move is stretched and no longer cheap on momentum terms.
- RSI at 72.1 and Stochastic %K at 90.2 show the stock is overbought, which raises the risk of a pause.
- MACD at 66.990 above the signal line, plus a positive histogram of 10.674, still supports the uptrend.
- Price above SMA20, SMA50, and the upper Bollinger band confirms strength, but also signals extension rather than a fresh base.
Verdict invalidated if price falls below 3,311.00, because that would break the nearest support and weaken the current trend structure.
- Ideal Entry Range: 3,434.73 to 3,582.00
- Exit Target: 3,612.00
- Stop Loss protection: 3,311.00
In plain English: Shell still looks strong, but the shares are running hot enough that the market may want to catch its breath before the next decisive move.
“We’re in the market’s hot zone now — strong, but one bad day from a sharper reset.”
Summary Data Shell
| Last price | 3,652.50 GBp |
| Change 1 day / 5 days / 1 month | 2.86% / 4.88% / 10.02% |
| Trend / MA-cross | uptrend / none |
| SMA20 / SMA50 | 3,434.73 / 3,313.92 |
| RSI (14) / Stochastic %K | 72.1 / 90.2 |
| Bollinger %B / ATR | 126% / 59.04 |
| Support / Resistance 20 days | 3,311.00 / 3,582.00 |
| Data as of | 14 September 2026 14:00 WIB |

