HSBC Stock Analysis: Drops 3.14%, Testing Support Level
On September 16, 2026: price 1,503.80 GBp, trend sideways, RSI 50.3, support 1,497.20, resistance 1,580.20. technical analysis of hsbc stock.

HSBC Holdings fell to 1,503.80 GBp on the LSE on 14 September 2026 at 14:00 WIB, down 3.14% on the day and extending a 4.76% slide over five days. The move leaves the stock just above its 1,497.20 short-term support, while the chart shows price sitting below the SMA20 at 1,535.41 and only slightly above the SMA50 at 1,524.66. That matters because it signals a market that is not in a clean uptrend or downtrend, but one where sellers have recently gained the upper hand inside a broader sideways range.
Trend & Price Action
The structure is still best described as sideways, but the tone has weakened. The SMA20 slope of 0.33% over five days suggests the short-term average is still edging higher, yet the share price trading under the SMA20 shows the market has slipped below its recent mean. In practical terms, that usually means rallies are being sold into before they can re-establish control. The lack of a fresh MA-cross also matters: there is no new moving-average confirmation of a trend shift, so the chart is not offering a strong directional signal yet.
The stock is also positioned low in its near-term band. With price near the bottom of the 1,497.20–1,580.20 support-resistance corridor and only 8% of the way up from support, the market is telling us it is testing demand rather than building momentum. The three-month range of 1,350.00 to 1,610.00 shows the current price is still closer to the lower half of the broader range, which reinforces the idea that recent weakness is more than just intraday noise.
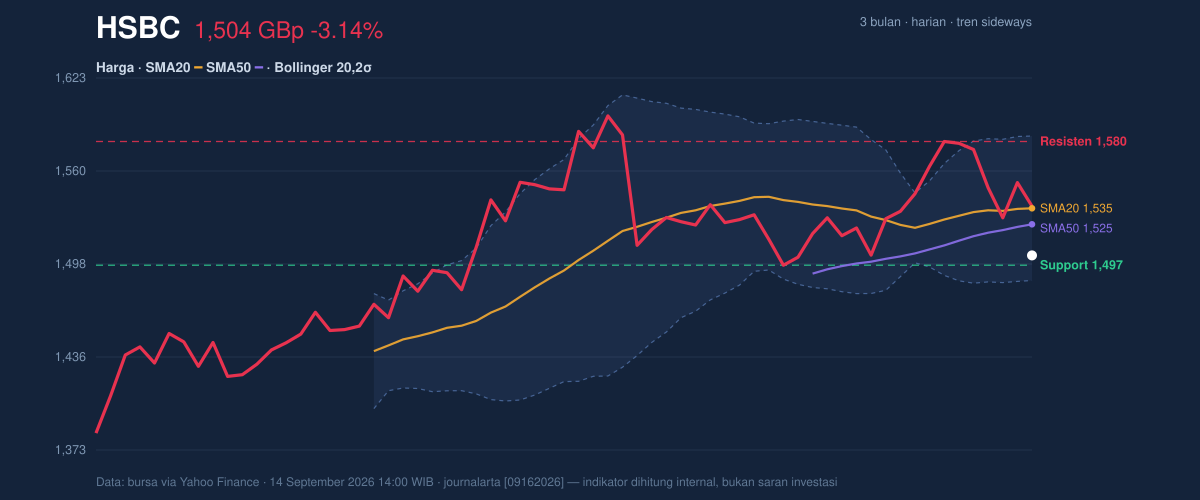
1,497.20 is the first level to watch because a decisive break below it would expose the lower edge of the recent range, while a move back above 1,535.41 would be the first sign that the stock is reclaiming its short-term average. For now, the market is balancing on support rather than breaking out from it.
Oscillators & Momentum
The momentum picture is mixed, but the bias is softer than the neutral headline readings suggest. The RSI at 50.3 is essentially neutral, which means the stock is neither stretched nor washed out on a one-dimensional momentum basis. The Stochastic %K at 42.5 and %D at 45.7 also sit in neutral territory, but they lean slightly weak because they are below the midpoint and not yet turning decisively higher. In plain language, the short-term bounce case has not been confirmed.
The more important signal is the MACD at 8.717 below the signal line at 9.836, leaving a -1.119 histogram. That combination indicates negative momentum: the stock’s recent price action is losing pace relative to its recent trend. MACD is not about where price is today; it is about whether the current move is strengthening or fading. Here, it is fading.
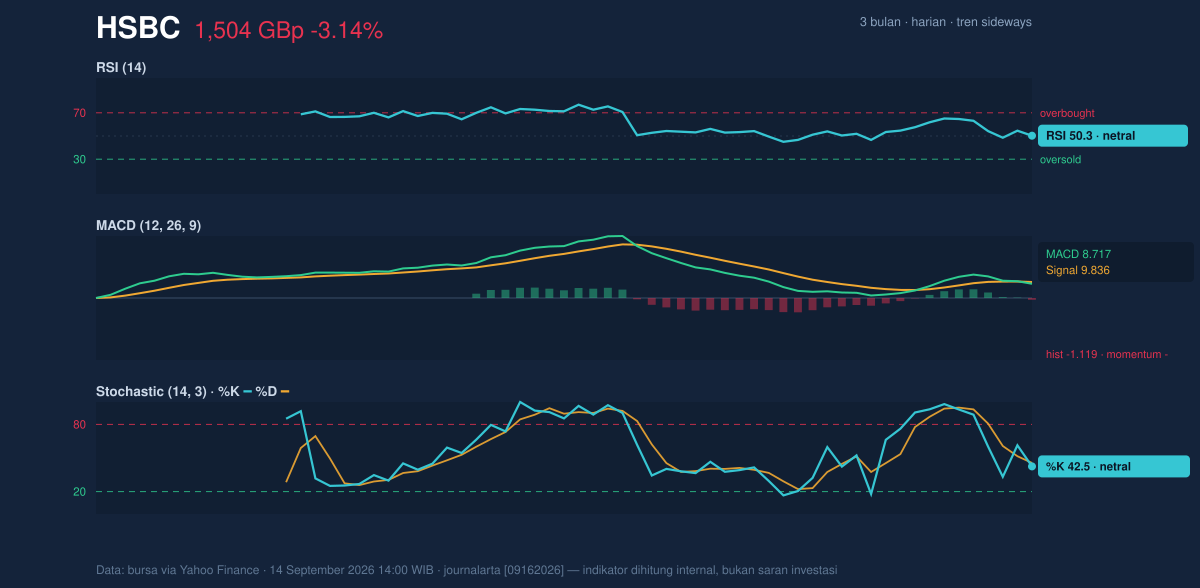
That matters because a neutral RSI with a negative MACD often points to a market that is not oversold enough to force a rebound, but not strong enough to sustain a push higher. The chart, as shown in the momentum panel, is therefore more consistent with consolidation under pressure than with an immediate trend reversal.
Volatility & Volume
The Bollinger setup is one of the more telling parts of the chart. Price is sitting near the lower band at 1,486.93, with %B at 17%. That means HSBC is trading near the bottom of its recent volatility envelope, a position that often reflects short-term stress or a lack of buying conviction. At the same time, the band width is only 6.3% and is narrowing, which suggests a squeeze. A squeeze does not predict direction, but it does warn that the current calm can give way to a sharper move once price escapes the range.
ATR at 29.15, or 1.9% of price, points to moderate daily volatility rather than disorderly trading. That means the stock can move, but the market is not yet in panic mode. Volume adds a subtle warning: the latest turnover of 42,616,963 was about 2.4× the 20-day average of 17,450,937, yet OBV is down. In other words, more shares changed hands, but the balance of volume still leans toward distribution rather than accumulation. Heavy volume without rising OBV often means the active side of the market is selling into strength or defending weakness rather than building a base.
That is a notable combination: a squeeze in volatility, heavy participation, and negative volume balance. It can precede a decisive move, but the current evidence says the market has not chosen a bullish direction.
Key Levels & Scenarios
The immediate battlefield is clear. 1,497.20 is first support, followed by the Bollinger lower band at 1,486.93. On the upside, the first hurdle is 1,524.66 at the SMA50, then 1,535.41 at the SMA20, and finally 1,580.20 resistance. A sustained move above the moving averages would improve the tone because it would show price is reclaiming the averages that currently sit overhead.
If 1,497.20 fails, the chart leaves little immediate cushion before the lower band at 1,486.93. If price can recover 1,535.41, the market would be back above its short-term reference point, which would reduce downside pressure. A push through 1,580.20 would matter more because it would clear the recent ceiling and force the market to look toward the upper band at 1,583.89 and beyond.
Technical Verdict: HOLD (wait & see)
HOLD (wait & see) fits the current setup because the chart is caught between a fragile support zone and overhead moving averages, while momentum remains only neutral-to-negative.
- MACD is below its signal line, with a -1.119 histogram, showing momentum is still soft.
- Price below SMA20 and no fresh MA-cross mean the stock has not reclaimed short-term trend control.
- Bollinger squeeze with %B at 17% suggests a larger move may be coming, but direction is not yet confirmed.
The verdict is invalidated if price breaks below 1,486.93, because that would confirm a downside escape from the current band.
- Ideal Entry Range: 1,497.20–1,524.66
- Exit Target (Target Price): 1,580.20 to 1,583.89
- Stop Loss protection: below 1,486.93
In plain English: HSBC is sitting on support, but the chart has not yet proved that buyers are back in charge.
Volume on the latest session was 42,616,963 shares, versus a 20-day average of 17,450,937.
Summary Data HSBC
| Last price | 1,503.80 GBp |
| Change 1 day / 5 days / 1 month | -3.14% / -4.76% / -1.57% |
| Trend / MA-cross | sideways / none |
| SMA20 / SMA50 | 1,535.41 / 1,524.66 |
| RSI (14) / Stochastic %K | 50.3 / 42.5 |
| Bollinger %B / ATR | 17% / 29.15 |
| Support / Resistance 20 days | 1,497.20 / 1,580.20 |
| Data as of | 14 September 2026 14:00 WIB |

