BP Stock Gains 2.78% Today, Testing Key Resistance
On September 16, 2026: price 580.30 GBp, trend uptrend, RSI 67.2, support 514.50, resistance 571.20. technical analysis of bp stock. BP Stock Gains — full…

BP plc is pressing against the upper edge of its recent range, and that matters because the shares are now trading in a zone where momentum and overextension are both visible at the same time. In London morning trade, BP.L last changed hands at 580.30 GBp, up 2.78% on the day, extending a 6.20% gain over 5 days and a 10.98% rise over 1 month.
The move is not happening in a vacuum. It is unfolding against a broader uptrend, with the SMA20 at 541.33 sitting above the SMA50 at 528.81. That relationship matters because it tells readers the short-term trend is still running ahead of the medium-term average, a sign that recent buying has been strong enough to lift the price structure rather than merely bounce within it. There has been no fresh MA-cross, so this is not a newly triggered trend signal; it is more a case of an already constructive trend being tested near its upper boundary.
Trend & Price Action
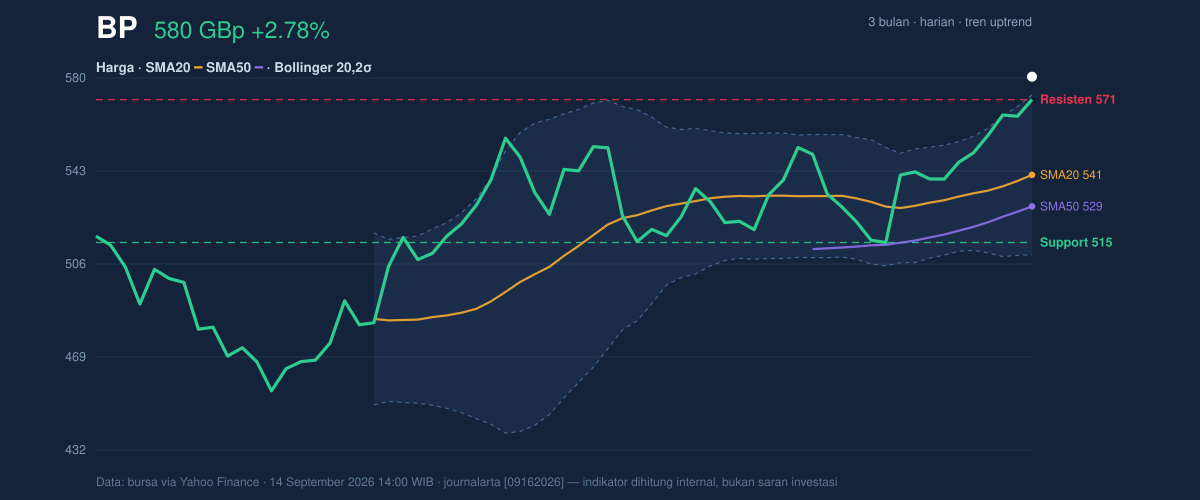
The chart shows BP trading above both moving averages, with price sitting well above the Bollinger middle band at 541.33. That placement is important: it means the market is not just recovering, it is holding gains above the zone that often acts as a reference point for trend-following traders. The stock is also above the 20-hour support at 514.50 and has moved beyond the 20-hour resistance at 571.20, which had previously capped upside attempts.
The signal is strong, but not cleanly comfortable. BP is now at 116% of its 20-hour range, which indicates price has pushed through the top of the recent band rather than merely sitting inside it. In plain English, the market is extended. That does not automatically mean reversal, but it does mean the next move becomes more sensitive to whether buyers can keep absorbing supply at higher levels. The 3-month high at 578.00 has already been exceeded, which turns the recent breakout into the key question: can the shares hold above the prior ceiling, or will profit-taking drag them back into the old range?
Oscillators & Momentum
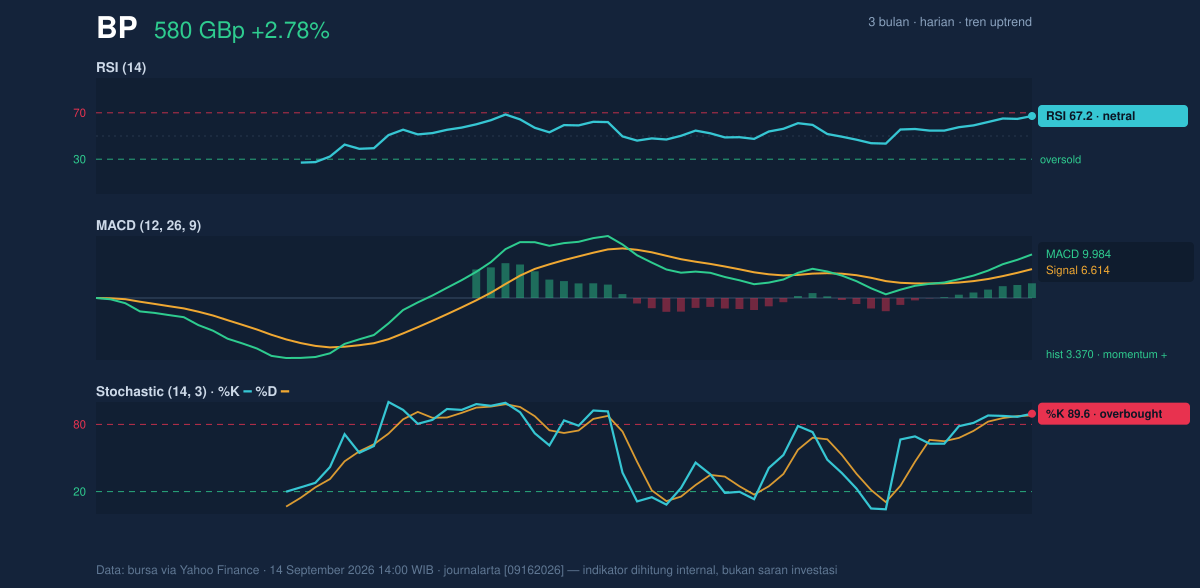
Momentum indicators are sending a mixed but mostly supportive message. The RSI at 67.2 is described as neutral, but it is close to the upper end of the range where momentum often starts to look stretched. More telling is the Stochastic %K at 89.6 and %D at 88.0, which is clearly overbought. That does not mean the stock must fall; it means the recent advance has been fast enough that the market is near the top of its short-term momentum cycle.
At the same time, the MACD at 9.984 remains above the signal line at 6.614, with a positive histogram of 3.370. This matters because MACD is still confirming upward momentum rather than warning of a trend break. In other words, the oscillator mix says the rally is still alive, but it is no longer fresh. The Stochastic is flashing “extended,” while MACD is still saying “trend intact.” That combination often appears when a stock is strong enough to keep climbing, yet vulnerable to pauses or brief pullbacks.
Volatility & Volume
Volatility is not spiking aggressively. The ATR at 16.03, equal to 2.8% of price, points to moderate volatility rather than disorderly trading. The Bollinger Band width of 11.7% is also described as normal, which suggests the move is not being driven by a volatility squeeze or a panic expansion. Instead, the price is advancing in a fairly orderly channel, and the key issue is whether it can remain above the upper band at 573.08 without snapping back toward the middle band.
Volume adds credibility to the move. The latest turnover of 69,935,772 shares is about 1.6× the 20-hour average of 43,110,497. That kind of participation usually means the move is being supported by real market interest rather than a thin, low-liquidity push. The OBV is rising, which reinforces that buyers have been accumulating on balance. When price is making new highs and OBV is rising too, the market is generally telling you demand is still present. The question is not whether buyers showed up; it is whether they will keep showing up at these levels.
Key Levels & Scenarios
The immediate technical map is clear. The first area to watch is the former ceiling at 571.20, now acting as a nearby reference for whether the breakout can hold. Above that, the market is already trading beyond the 3-month high of 578.00, so that level becomes a psychological checkpoint rather than fresh resistance. On the downside, the most important cushion is the 20-hour support at 514.50, followed by the Bollinger middle band at 541.33, which often acts as a trend pivot in an advancing market.
If BP holds above 573.08 and continues to respect the breakout zone, the chart remains constructive. If it slips back below 571.20 and then loses the 541.33 mid-band, that would suggest the move was running ahead of itself and needs to reset. A break under 514.50 would be a much clearer sign that the recent advance has failed to hold.
Technical Verdict: HOLD (wait & see)
HOLD (wait & see)
- MACD remains positive, so the broader upward impulse is still intact.
- Volume is 1.6× average and OBV is rising, which supports the breakout attempt.
- Stochastic is overbought and price is already above the upper Bollinger band at 573.08, so the shares look extended in the short term.
Verdict invalidated if price breaks below 514.50.
- Ideal entry range: around 541.33 to 571.20, where the Bollinger middle band and prior resistance may offer a more stable technical base.
- Exit target: 578.00 as the prior 3-month high, with 580.30 already showing the market can test that zone.
- Stop loss protection: below 514.50, the nearest defined support.
For non-traders, this means BP is strong, but the share price is already stretched enough that the next move is more likely to be a pause or test of support than a clean, low-risk chase higher.
Summary Data BP
| Last price | 580.30 GBp |
| Change 1 day / 5 days / 1 month | 2.78% / 6.20% / 10.98% |
| Trend / MA-cross | uptrend / none |
| SMA20 / SMA50 | 541.33 / 528.81 |
| RSI (14) / Stochastic %K | 67.2 / 89.6 |
| Bollinger %B / ATR | 111% / 16.03 |
| Support / Resistance 20 days | 514.50 / 571.20 |
| Data as of | 14 September 2026 14:00 WIB |

