Golden Cross Formed, AstraZeneca Stock Drops 2.23% Today
On Oktober 6, 2026: price 11,764.00 GBp, trend sideways, RSI 39.8, support 11,650.00, resistance 12,672.00. technical analysis of astrazeneca stock.
By Alistair Sterling
October 6, 20264 min read
Golden Cross Formed, AstraZeneca Stock Drops 2.23% Today
AstraZeneca fell 2.23% to 11,764.00 GBp by 14:00 WIB on 2 October, extending a five-day decline of 6.28%, according to market data from Yahoo Finance. The move leaves the London-listed shares below both their 20-day and 50-day averages, despite a recent golden cross—when the shorter-term average rises above the longer-term one. That crossover points to an improving underlying trend, but the latest price action shows it has not yet translated into near-term strength.
Trend & Price Action
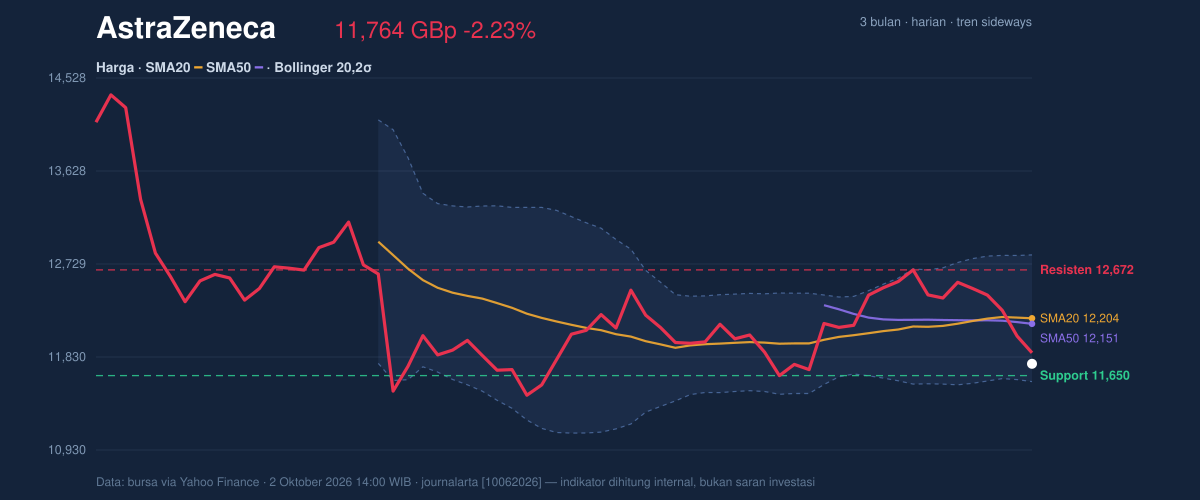
The shares are 3.6% below the 20-day simple moving average (SMA) of 12,204.20 GBp and 3.2% below the 50-day SMA of 12,150.64 GBp. The 20-day average has edged up by 0.43% over five days, while the broader trend is classified as sideways. Together, those readings suggest a weak pullback within an uncertain structure rather than a clear breakdown in the longer-term trend.
The golden cross is a constructive signal, but price trading below both averages limits its confirmation. AstraZeneca is also close to the lower end of its recent range: the quoted position is 11% of the way from the 20-hour support to resistance, while the three-month high and low stand at 14,526.00 GBp and 9,892.00 GBp. A range position near the bottom makes nearby support especially important.
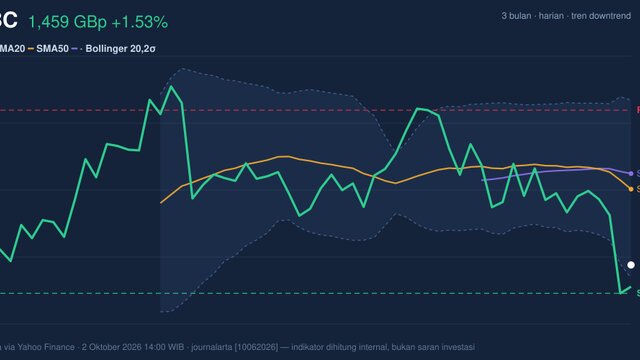
As shown in the chart, the lower Bollinger Band at 11,591.87 GBp is another reference point beneath the current price. Bollinger Bands track a moving average with boundaries based on price variation; the 10.0% band width is described as normal, not unusually compressed or expanded. The 14% %B reading places the price near the lower band, signalling pressure but not, by itself, a reversal.
3-month price action chart of AstraZeneca: price, SMA20/50, Bollinger, support & resistance. Data: exchange via Yahoo Finance.
Oscillators & Momentum
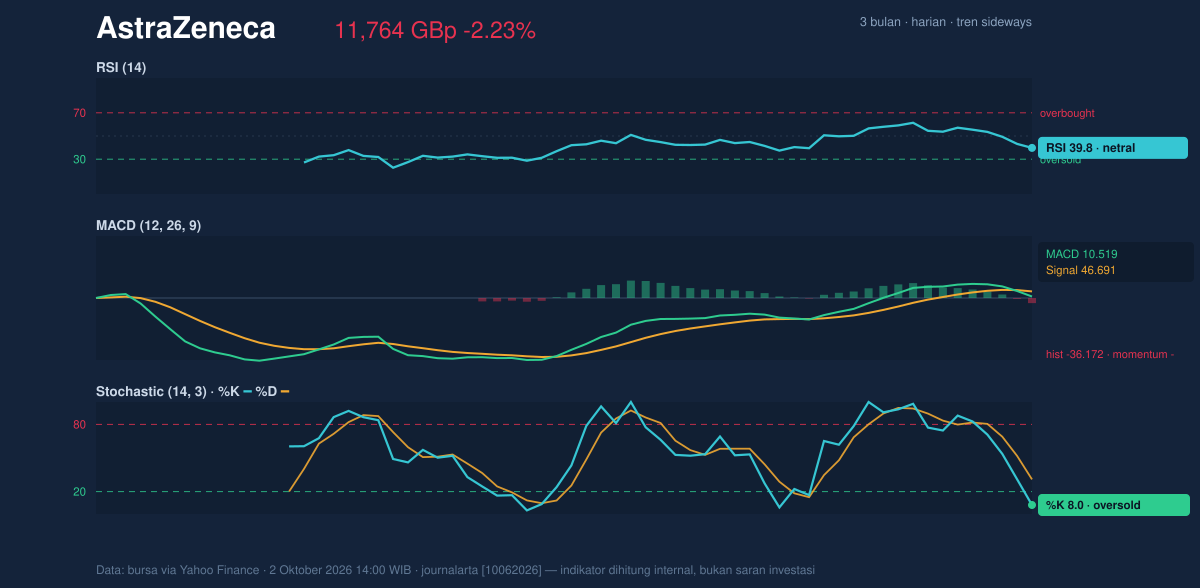
Momentum indicators are mixed, with the short-term readings weaker than the trend signal. The RSI is 39.8, a neutral reading; it is below the midpoint typically associated with stronger momentum, but not in the oversold zone. The Stochastic is oversold, with %K at 8.0 and %D at 30.9. This can occur after a sharp decline, but an oversold reading is not proof that selling has ended.
The MACD is negative: its 10.519 reading is below the 46.691 signal line, with a -36.172 histogram. MACD compares shorter- and longer-term price averages to gauge momentum. Here, it reinforces the evidence of recent weakness and does not yet confirm a turn higher. The Stochastic’s oversold condition may leave room for a rebound, but confirmation would require improvement in price and momentum rather than the oscillator alone.
Momentum chart of AstraZeneca: RSI(14), MACD, Stochastic. Data: exchange via Yahoo Finance.
Volatility, Volume & Key Levels
The average true range (ATR), a measure of typical daily price movement, is 256.10 GBp, or 2.2% of the share price. That indicates moderate volatility: swings remain meaningful, but the data do not point to an exceptional expansion in daily movement.
Trading volume was 1,659,275 shares, about half the 20-day average of 3,169,966, while on-balance volume (OBV)—a running measure that links volume with the direction of price changes—was declining. The low turnover means the sell-off was not accompanied by unusually heavy trading, but falling OBV offers little evidence that buyers are accumulating shares.
The first nearby test is support at 11,650.00 GBp, just below the lower Bollinger Band. Holding that area could allow the shares to stabilise; a break below it would weaken the case for a short-term floor. On a recovery, the SMA20 at 12,204.20 GBp and SMA50 at 12,150.64 GBp are initial hurdles, followed by resistance at 12,672.00 GBp. A sustained move above that resistance would provide stronger evidence that the pullback has eased.
Technical Verdict: HOLD (wait & see)
HOLD (wait & see) reflects the conflict between a golden cross and rising 20-day average on one side, and price below both averages, negative MACD momentum and declining OBV on the other. The oversold Stochastic could precede a bounce, but it has not yet been confirmed by the RSI or MACD. The verdict is invalidated if price breaks below 11,650.00 GBp, the stated 20-hour support.
Ideal Entry Range: 11,591.87–11,650.00 GBp, using the lower Bollinger Band and support as reference levels.
Exit Target: 12,672.00 GBp, the stated resistance level.
Stop Loss: Below 11,591.87 GBp, the lower Bollinger Band.
For non-traders, the indicators show a share price under pressure near support, with no clear confirmation yet that the decline has turned.
Data
AZN.L, London Stock Exchange; market data via Yahoo Finance, 2 October 2026, 14:00 WIB. Last price: 11,764.00 GBp; previous close: 12,032.00 GBp; daily change: -2.23%; five-day change: -6.28%; one-month change: -2.02%.