Death Cross Pressure, HSBC Stock Gains 1.53% Today
On Oktober 6, 2026: price 1,459.00 GBp, trend downtrend, RSI 34.4, support 1,437.00, resistance 1,579.00. technical analysis of hsbc stock.
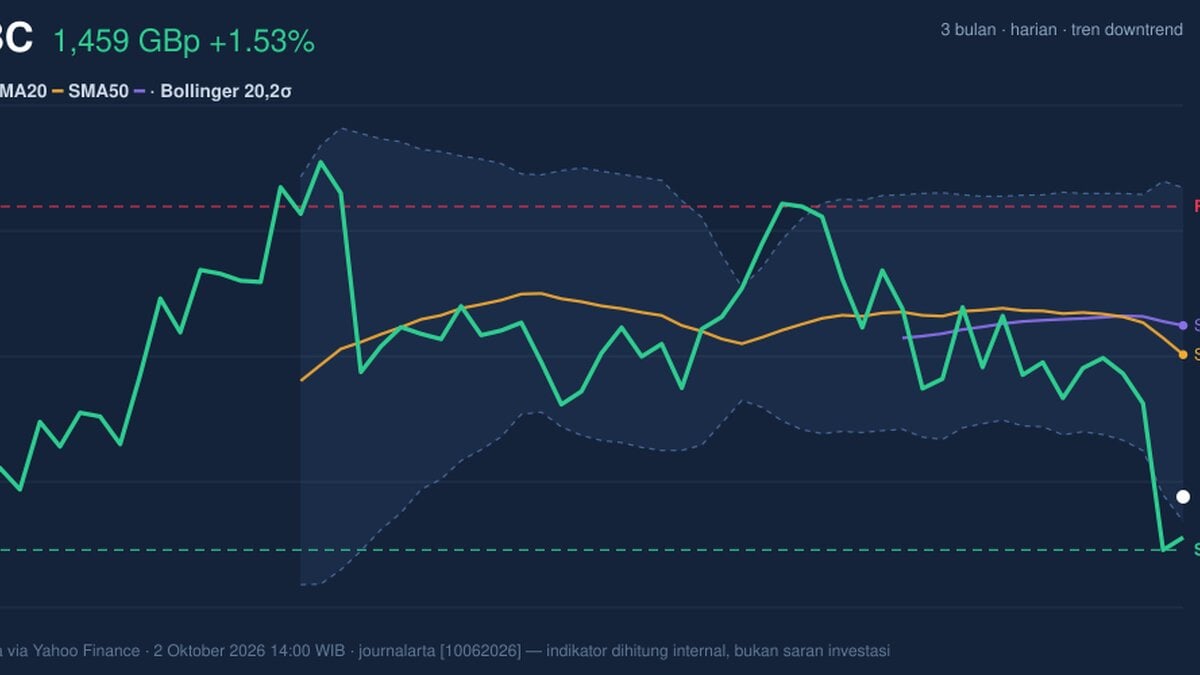
HSBC Holdings rose 1.53% to 1,459.00 GBp on the London Stock Exchange on 2 October, recovering from a previous close of 1,437.00 GBp but remaining within a broader decline. The shares are down 3.52% over five days and 7.67% over one month, according to market data from the exchange via Yahoo Finance. The one-day gain has not yet shifted the underlying technical picture: price remains below both key moving averages, while several momentum measures are still weak.
Trend & Price Action
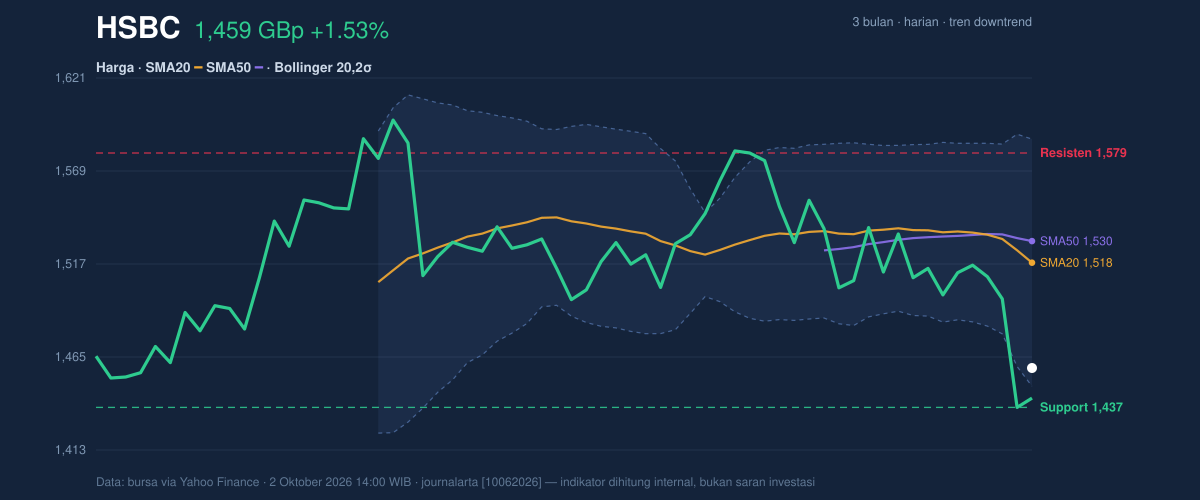
At 1,459.00 GBp, HSBC trades below its 20-day simple moving average (SMA) of 1,517.80 GBp and its 50-day SMA of 1,529.82 GBp. The 20-day average is also sloping down, falling 1.13% over five days. More importantly, the shorter average has crossed below the longer one, a pattern known as a death cross. It signals that recent trading has weakened relative to the preceding trend; it does not, by itself, establish how long that weakness will last.
The distance to the averages matters: the share price is 58.80 GBp below its SMA20 and 70.82 GBp below its SMA50. A rebound that stalls beneath those levels would leave the downtrend structure intact. The stock sits in the lower part of its 20-day range, with support at 1,437.00 GBp and resistance at 1,579.00 GBp. Its three-month high and low are 1,610.00 GBp and 1,350.00 GBp, respectively.
The latest rise is a pause, not yet a reversal.
As shown in the chart, the falling averages and lower-band proximity frame the immediate price structure.
Oscillators & Momentum
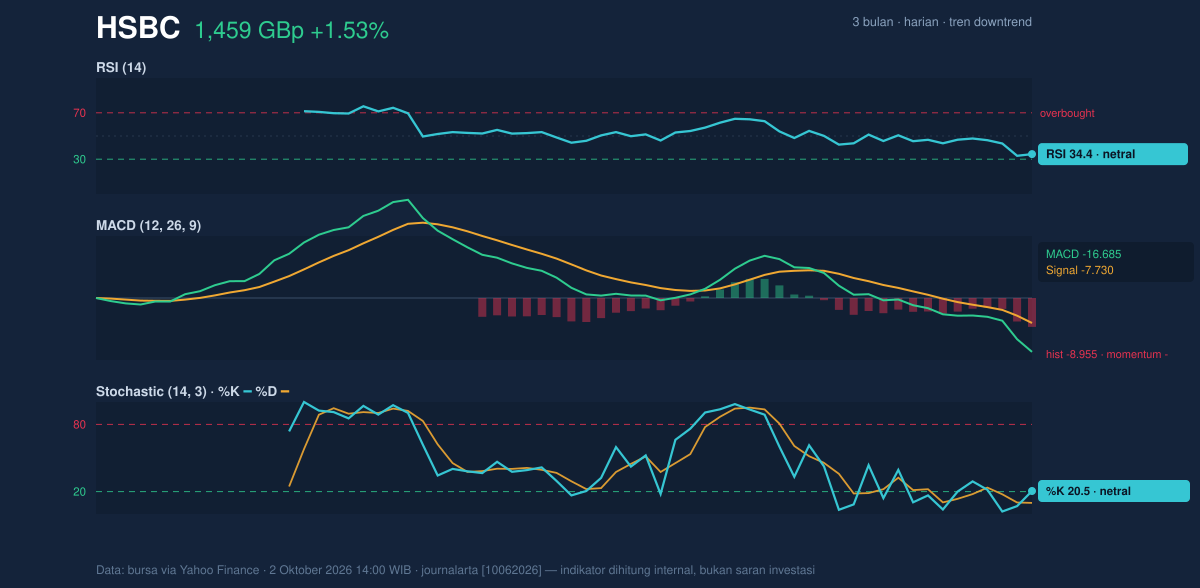
The relative strength index (RSI), which measures the speed and scale of recent price changes, is 34.4. That reading is described as neutral in the supplied data: it is weak, but does not meet the usual threshold for an oversold reading. The Stochastic indicator is similarly subdued, with %K at 20.5 and %D at 9.9, also classified as neutral. These measures show limited buying momentum, rather than a confirmed turn higher.
The moving average convergence divergence (MACD) offers the clearest warning. Its reading of -16.685 is below its -7.730 signal line, and the histogram is negative at -8.955. MACD remains negative, meaning short-term momentum is still weaker than its signal benchmark. That aligns with the declining averages and falling monthly performance; it does not confirm the one-day advance as a trend change.
As shown in the momentum chart, the indicators remain subdued rather than aligned behind a sustained rebound.
Volatility, Volume & Key Levels
The Bollinger Bands place the price close to the lower boundary: the band runs from 1,448.82 GBp at the bottom to 1,586.78 GBp at the top, with a middle line at 1,517.80 GBp. A %B reading of 7% means the share is near the lower end of that band. This can reflect persistent selling pressure, though proximity to the lower band alone is not a reversal signal. The band width is 9.1%, described as normal, so the data do not show an unusually tight volatility squeeze.
Average true range (ATR), a measure of typical price movement, is 31.26 GBp, or 2.1% of the share price, indicating moderate volatility. Trading volume was 19,701,653 shares, about 1.0 times the 20-day average of 19,749,231. Participation was therefore close to normal, while falling on-balance volume (OBV)—a measure that tracks whether volume tends to accompany rising or falling prices—does not provide confirmation of accumulation.
Support at 1,437.00 GBp is the nearest test: a break below it would put the three-month low of 1,350.00 GBp in focus. Holding support could allow a move toward the moving-average area, but resistance at 1,579.00 GBp remains the stated 20-day ceiling. A recovery above that level would be a stronger sign of improving price structure than the latest single-session gain.
Technical Verdict: SELL
SELL is the technical reading of the supplied indicators, reflecting the prevailing downward structure rather than a forecast. The strongest reasons are the death cross, negative MACD momentum and declining OBV. The reading is invalidated if price breaks above 1,579.00 GBp, the stated 20-day resistance.
- Ideal Entry Range: 1,448.82–1,459.00 GBp, bounded by the lower Bollinger Band and the latest price; this is a technical reference, not a trade instruction.
- Exit Target (Target Price): 1,437.00 GBp, the stated 20-day support level.
- Stop Loss protection: 1,517.80 GBp, the SMA20, as a level above the current price that would challenge the immediate bearish setup.
In plain English, the indicators still point down, although holding support or reclaiming resistance would weaken that signal.
| Metric | Reading |
|---|---|
| Last price | 1,459.00 GBp |
| Change | 1 day: 1.53% | 5 days: -3.52% | 1 month: -7.67% |
| SMA20 / SMA50 | 1,517.80 / 1,529.82 GBp |
| RSI(14) | 34.4 (neutral) |
| Stochastic %K / %D | 20.5 / 9.9 (neutral) |
| MACD / signal / histogram | -16.685 / -7.730 / -8.955 |
| Support / resistance | 1,437.00 / 1,579.00 GBp |
| ATR(14) | 31.26 GBp (2.1%) |
Summary Data HSBC
| Last price | 1,459.00 GBp |
| Change 1 day / 5 days / 1 month | 1.53% / -3.52% / -7.67% |
| Trend / MA-cross | downtrend / death |
| SMA20 / SMA50 | 1,517.80 / 1,529.82 |
| RSI (14) / Stochastic %K | 34.4 / 20.5 |
| Bollinger %B / ATR | 7% / 31.26 |
| Support / Resistance 20 days | 1,437.00 / 1,579.00 |
| Data as of | 2 Oktober 2026 14:00 WIB |
Track HSBC share price daily: live levels, support/resistance and our full HSBC analysis history.