BP Momentum Weakens: Stock Gains 0.13% (Oktober 5, 2026)
On Oktober 5, 2026: price 557.80 GBp, trend sideways, RSI 53.5, support 542.30, resistance 580.30. technical analysis of bp stock. BP Momentum Weakens — full…

BP plc is trading in a tight technical middle ground in London, with the shares hovering just under short-term trend support while broader momentum remains mixed and volume participation looks subdued.
BP’s last price was 557.80 GBp on the LSE, a modest 0.13% rise from the previous close, but that small gain does little to change the larger picture. The stock is still moving in a sideways pattern, and as shown in the chart, price sits below the SMA20 at 558.77 even though it remains above the SMA50 at 543.21. That combination matters: it suggests BP is neither in a clean short-term uptrend nor in a damaging longer-term breakdown. Instead, it is trading between two reference points, with the 20-day average acting as a near-term ceiling and the 50-day average offering deeper support.
Trend & Price Action
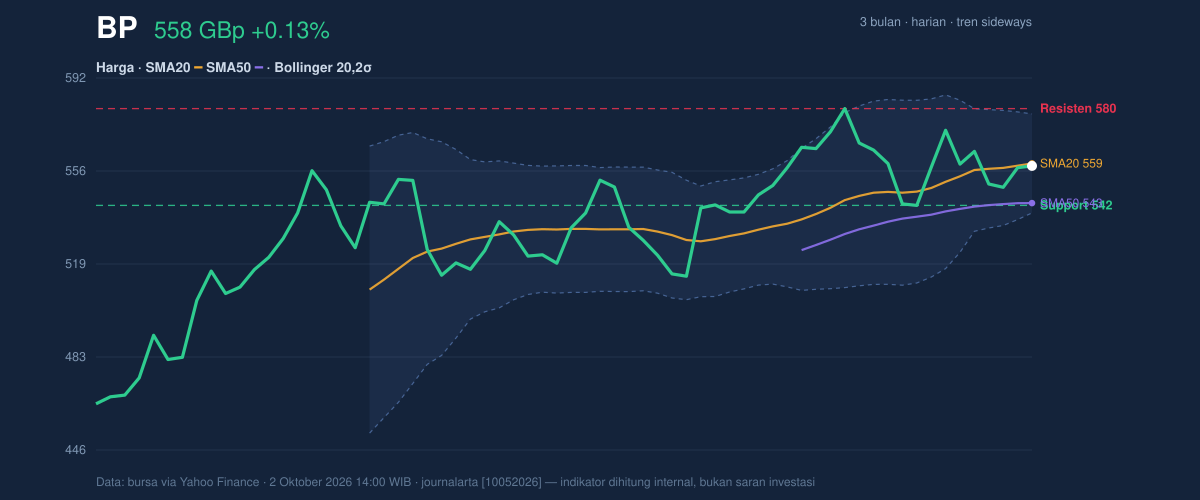
The broader structure is still constructive enough to avoid a bearish trend call, but not strong enough to signal momentum leadership. The absence of a new MA-cross means the moving averages are not delivering a fresh directional signal. In practical terms, that often leaves the market waiting for a catalyst. The stock is also positioned at 41% of its 20-hour range, which places it in the lower-middle part of the recent band rather than near the top. That is consistent with a market that has room to move either way, but has not yet chosen a direction.
The 3-month range gives more context. BP’s shares have traded between 450.60 and 582.60 over that period, and the current price is closer to the upper half of that span. That is important because it shows the stock has recovered from the lower end of its recent range, yet has not broken into fresh territory. The nearby resistance at 580.30 and the 3-month high at 582.60 are effectively the same test area: if BP can clear that zone, the chart would shift from consolidation to a possible breakout attempt. If not, the shares may continue to drift around the middle of the range.
Oscillators & Momentum
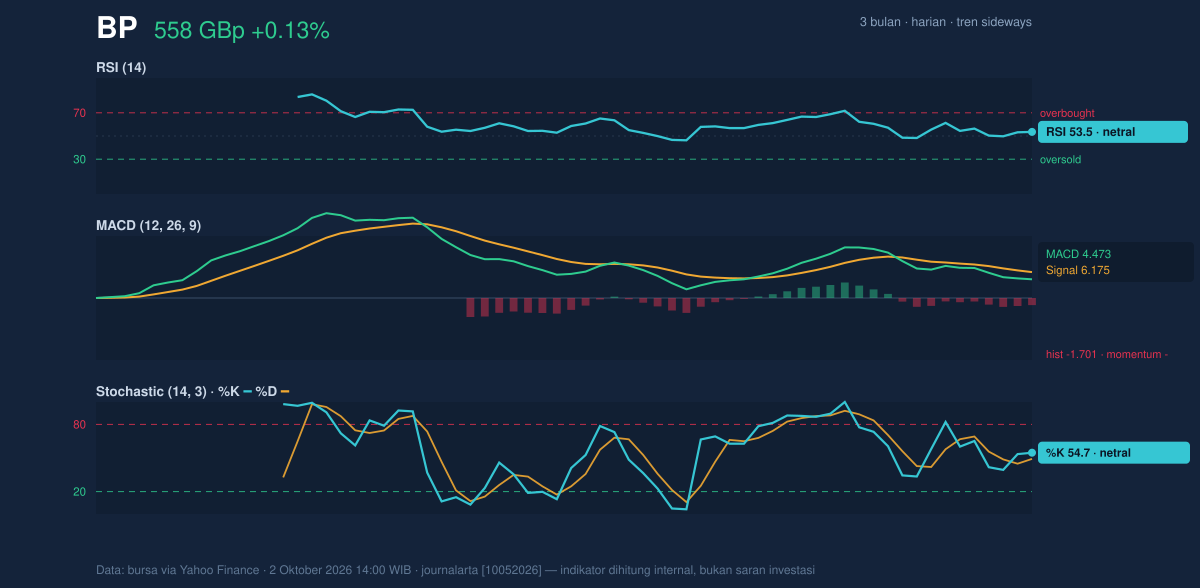
The momentum indicators are mostly neutral, but not uniformly so. RSI at 53.5 signals balance rather than excess — neither overbought nor oversold. Stochastic %K at 54.7 and %D at 49.2 also sit in neutral territory, which reinforces the idea that BP is not stretched in either direction. For readers unfamiliar with these tools: RSI and Stochastic are gauges of speed and pressure in price movement; values near the middle usually mean the market is waiting rather than forcing a trend.
The more cautionary signal comes from MACD. MACD at 4.473 is still below the signal line at 6.175, leaving a -1.701 histogram. That negative histogram means short-term price momentum is softer than the trend baseline, even though the broader price action has not broken down. In plain language, BP is not losing ground aggressively, but the latest push higher lacks conviction. That is the kind of setup that often needs either stronger buying or a clear support test before the next move becomes obvious.
Volatility & Volume
The Bollinger Bands add another layer to the story. BP is trading near the middle of the band structure, with %B at 47%, which means price is slightly below the midline rather than pressing the upper band. The bands themselves are relatively tight, with 7.0% width, and the chart shows a squeeze. That matters because squeezes often precede a larger move: compressed volatility does not predict direction, but it does suggest the market may be storing energy for a break.
The average true range, or ATR, stands at 15.72, equal to 2.8% of price. That points to moderate daily movement potential rather than a highly turbulent tape. On its own, that is not dramatic, but combined with the Bollinger squeeze it suggests BP could be setting up for a wider swing once the current consolidation resolves.
Volume, however, is not confirming urgency. Last session’s volume was 29,528,616, well below the 20-day average of 47,852,160, or about 0.6× normal. At the same time, OBV is falling, which indicates that volume flow has not been supporting price stability. OBV, or on-balance volume, tracks whether trading volume tends to accumulate on up days or down days; a decline here suggests buyers are not yet asserting control. That weak participation is one reason the current range has not resolved decisively.
Key Levels & Scenarios
The immediate map is clear. Support sits at 542.30, while resistance is 580.30. The moving averages sit in between, with the SMA50 at 543.21 just above support and the SMA20 at 558.77 close to the current price. That alignment makes the zone between 543 and 559 especially important: it is where BP is trying to hold its footing.
If price can reclaim and hold above 558.77, it would improve the short-term tone and bring the 580.30 resistance back into focus. If price slips below 543.21, the chart would lose the support of the 50-day average and shift attention toward the lower end of the range. A move under 542.30 would be more damaging because it would break the nearest support and expose the stock to a retest of the broader range floor.
Technical Verdict: HOLD (wait & see)
HOLD (wait & see)
- RSI 53.5 and Stochastic 54.7 / 49.2 are neutral, so momentum is not strong enough to confirm a directional move.
- MACD 4.473 below signal 6.175 with a -1.701 histogram shows negative near-term momentum.
- Price below SMA20 558.77 but above SMA50 543.21, while the Bollinger squeeze hints that a break may be coming, but not yet.
Verdict invalidated if price falls below 542.30, because that would break the nearest support and weaken the current range structure.
- Ideal Entry Range: 543.21 to 558.77
- Exit Target (Target Price): 580.30
- Stop Loss protection: below 542.30
For non-traders, this means BP is sitting in a waiting zone: the chart is not broken, but it has not yet proved it can move cleanly higher.
Summary Data BP
| Last price | 557.80 GBp |
| Change 1 day / 5 days / 1 month | 0.13% / -0.13% / 3.35% |
| Trend / MA-cross | sideways / none |
| SMA20 / SMA50 | 558.77 / 543.21 |
| RSI (14) / Stochastic %K | 53.5 / 54.7 |
| Bollinger %B / ATR | 47% / 15.72 |
| Support / Resistance 20 days | 542.30 / 580.30 |
| Data as of | 2 Oktober 2026 14:00 WIB |
Track BP share price daily: live levels, support/resistance and our full BP analysis history.



