AstraZeneca Stock Drops 1.35%, Golden Cross Formed In Focus
On Oktober 5, 2026: price 11,870.00 GBp, trend sideways, RSI 39.6, support 11,650.00, resistance 12,672.00. technical analysis of astrazeneca stock.

AstraZeneca shares on the LSE fell to 11,870.00 GBp by 14:00 WIB on 2 October 2026, down 1.35% on the day and extending a weak patch that has left the stock below both its short-term averages. The move matters because it puts the shares back under pressure even though the broader chart still shows a golden cross, a pattern that usually signals improving longer-term trend structure. In plain terms, the market is saying the medium-term setup has not fully broken, but near-term sellers are still in control.
Trend & Price Action
The price sits below the SMA20 at 12,204.20 and also below the SMA50 at 12,150.64, which is an important nuance: the stock is not trading with the momentum you would normally expect after a bullish moving-average crossover. The golden cross itself remains in place, meaning the 20-day average has moved above the 50-day average, but the current price is trading underneath both. That combination often points to a market that has improved on paper, yet has not attracted enough follow-through buying to hold above the trend line.
The trend is described as sideways, and the SMA20 slope of 0.43% over 5 days suggests only modest upward drift rather than a decisive breakout. The stock is also sitting in the lower part of its recent range, with the price at 22% of the 20-hour range. That positioning tells readers the market is leaning toward the lower end of the band, not testing the upper boundary.
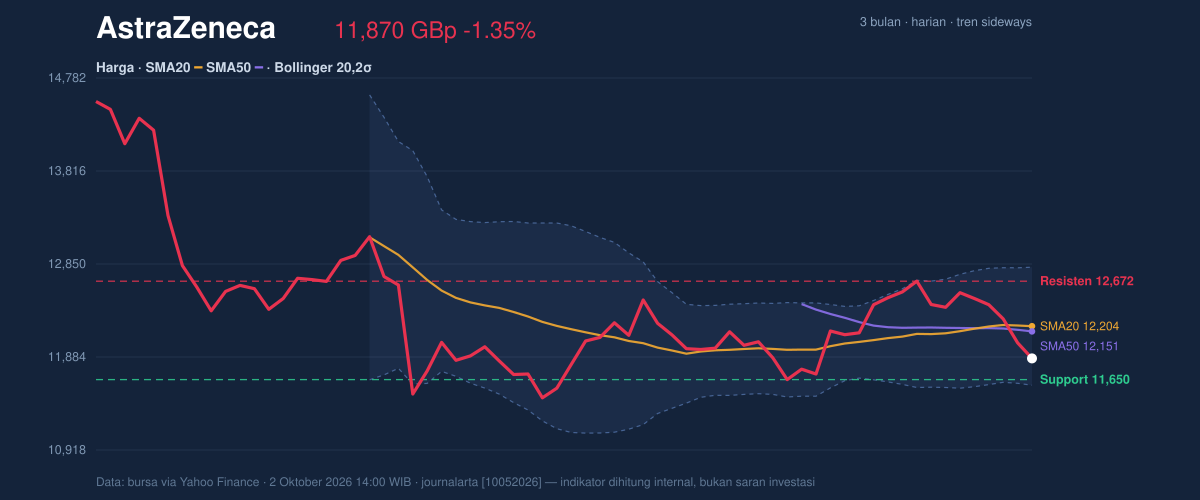
The chart also shows a clear nearby floor at 11,650.00 and an overhead barrier at 12,672.00. Those levels matter because they frame the immediate tug-of-war: if the share price cannot recover above the moving averages, it remains vulnerable to another test of support.
Oscillators & Momentum
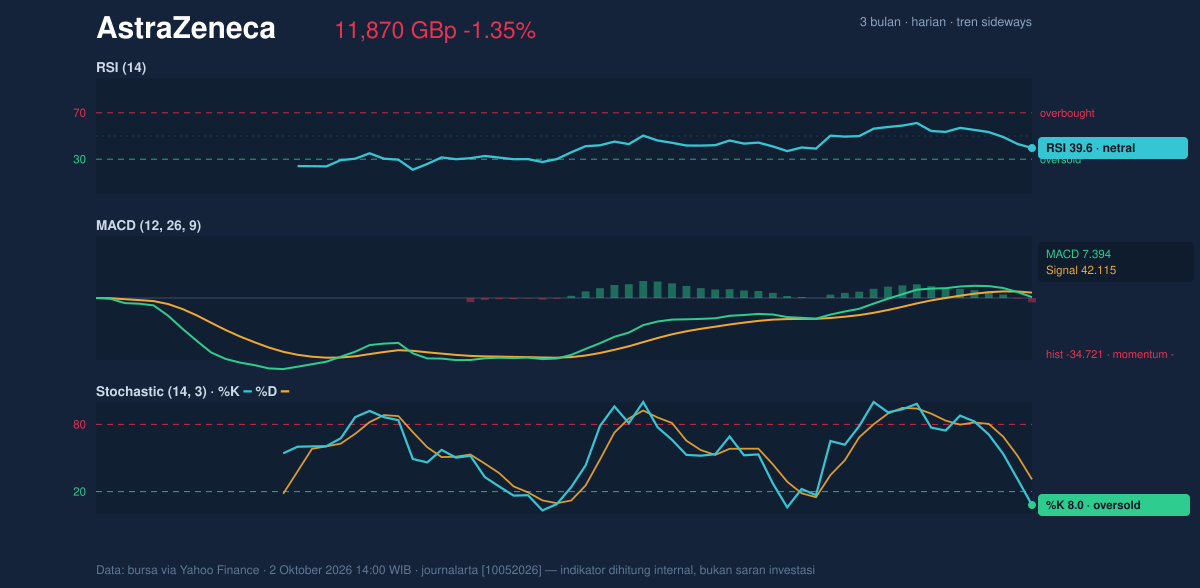
The momentum picture is softer than the moving-average structure. The RSI at 39.6 is neutral, but it is leaning toward the weaker side of the scale. RSI is a gauge of whether recent gains or losses have been stretched; a reading near 40 does not signal panic, but it does show buyers have not yet rebuilt conviction.
More striking is the Stochastic %K at 8.0 versus %D at 30.9. That is an oversold reading, and it suggests the stock has been sold hard enough in the short term that a technical bounce is possible. Oversold does not mean “cheap” in a fundamental sense; it simply means the recent pace of selling may be extended. The catch is that oversold conditions can persist when trend confirmation is weak.
The MACD setup is less encouraging. MACD at 7.394 sits below the signal line at 42.115, with a histogram of -34.721. That negative histogram is the clearest signal in the momentum set: it shows downside momentum is still dominant, even if the stock is not in a full-blown breakdown. In other words, the short-term oscillator is stretched, but the trend-following indicator has not yet turned.
Volatility & Volume
Bollinger Bands help show where price sits relative to its recent trading envelope. The shares are closer to the lower band at 11,591.87 than to the upper band at 12,816.53, with %B at 23%. That means the stock is trading in the lower quarter of its recent volatility range, which is consistent with weakness but also leaves room for a rebound if buyers step in. The 10.0% band width is described as normal, so this is not a squeeze pattern that usually precedes an explosive move. It is a standard volatility backdrop, with room for movement but no obvious compression signal.
The ATR at 256.10, or 2.2% of price, indicates moderate day-to-day movement. That is enough to matter for short-term positioning, but not so wide that the chart is behaving erratically. Volume is more revealing: last trade volume of 1,659,275 was only 0.5× the 20-day average, and OBV is falling. OBV, or on-balance volume, tracks whether trading activity is accumulating or distributing shares over time. A falling OBV alongside light volume suggests sellers have been more active than buyers, and the current dip is not yet being challenged by strong participation.
Key Levels & Scenarios
The immediate support zone is led by 11,650.00, with the lower Bollinger band at 11,591.87 adding a second technical shelf. On the upside, the first meaningful hurdle is 12,204.20, where the SMA20 sits, followed by 12,672.00 and then the Bollinger upper band at 12,816.53. The 3-month range gives additional context: 9,892.00 to 14,686.00. That wider corridor shows the stock is not near an extreme on the long view, even if the short-term chart is under pressure.
If price holds above 11,650.00 and reclaims 12,204.20, the chart would start to look less fragile. If it fails to hold 11,650.00, the lower Bollinger band becomes the next reference point, and the negative MACD and weak OBV would become more concerning. The signal is not one of collapse, but of a market still waiting for proof that demand is returning.
Technical Verdict: HOLD (wait & see)
HOLD (wait & see)
- Reason 1: The chart still carries a golden cross, but price is trading below SMA20 and SMA50, so the bullish structure has not been confirmed by price.
- Reason 2: MACD remains negative and the histogram is below zero, showing downside momentum is still active.
- Reason 3: Stochastic is oversold and %B is low at 23%, which leaves room for a bounce, but volume is 0.5× average and OBV is falling, so participation is weak.
- Verdict invalidated if price breaks below 11,591.87, the lower Bollinger band, with 11,650.00 as the nearer support to watch.
- Ideal entry range: 11,650.00 to 12,150.64
- Exit target: 12,204.20 to 12,672.00
- Stop loss protection: below 11,591.87
For non-traders, this means the shares are weak right now, but the chart has not yet confirmed a full breakdown.
Summary Data AstraZeneca
| Last price | 11,870.00 GBp |
| Change 1 day / 5 days / 1 month | -1.35% / -5.43% / -1.13% |
| Trend / MA-cross | sideways / golden |
| SMA20 / SMA50 | 12,204.20 / 12,150.64 |
| RSI (14) / Stochastic %K | 39.6 / 8.0 |
| Bollinger %B / ATR | 23% / 256.10 |
| Support / Resistance 20 days | 11,650.00 / 12,672.00 |
| Data as of | 2 Oktober 2026 14:00 WIB |
Track AstraZeneca share price daily: live levels, support/resistance and our full AstraZeneca analysis history.



