HSBC Stock Gains 0.36%, Death Cross Pressure In Focus
On Oktober 5, 2026: price 1,442.20 GBp, trend downtrend, RSI 34.4, support 1,437.00, resistance 1,579.00. technical analysis of hsbc stock.

HSBC Holdings ended at 1,442.20 GBp, just above the prior close but still trapped beneath its short- and medium-term moving averages, with the chart showing a death cross and a clear downtrend. The share is now sitting close to the lower Bollinger band at 1,448.82, which matters because it suggests the market is pressing against the lower edge of its recent trading envelope rather than building momentum back toward the centre line.
Trend & Price Action
The bigger message from the price structure is not the modest daily gain, but the fact that it is happening inside a weakening trend. HSBC is trading below the SMA20 at 1,517.80 and the SMA50 at 1,529.82, with the death cross indicating that shorter-term price strength has already rolled over beneath a slower trend gauge. In technical terms, that crossover often signals that rallies are being sold rather than extended. The stock is also down 4.63% over 5 days and 8.73% over 1 month, which shows the recent drift is not a one-day fluctuation but part of a broader loss of traction.
The current price is only a little above the 20-hour support at 1,437.00, and the chart places HSBC in the lower part of its recent range. That positioning matters because stocks near support can either stabilise if buyers defend the level, or slip quickly if the floor gives way. The 3-month range, from 1,350.00 to 1,610.00, shows there is still room for movement in either direction, but the burden of proof is on the bulls until the price reclaims the moving averages.
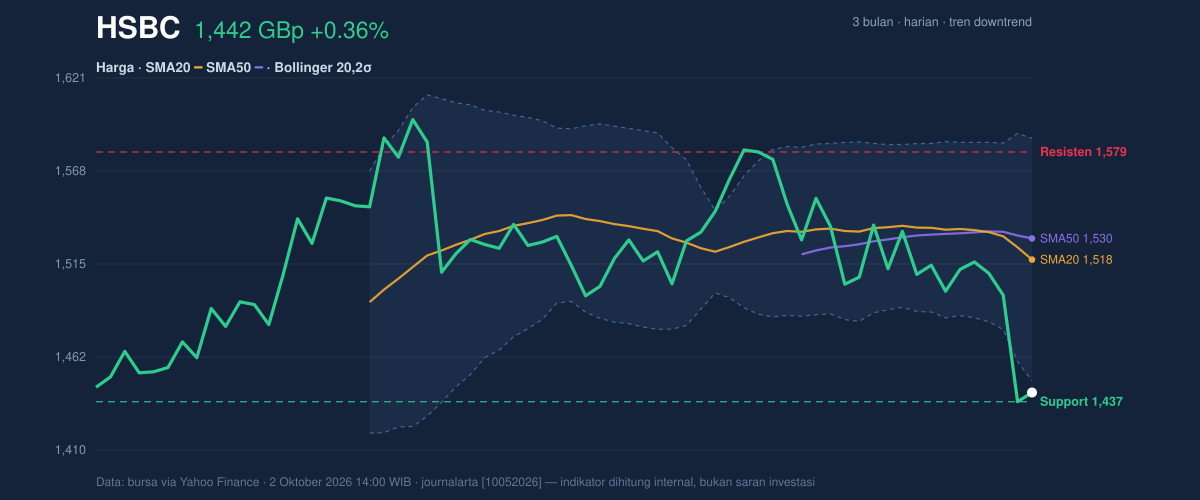
One short line captures the setup: the trend is still down, and the nearest support is being tested rather than respected with conviction.
Oscillators & Momentum
The momentum picture is mixed on the surface, but the underlying signal is weak. RSI at 34.4 is technically neutral, yet it sits close to the lower end of the range, which usually means selling pressure has eased but not fully reversed. Stochastic %K at 20.5 and %D at 9.9 also read as neutral, but they are low enough to suggest the stock is not in a strong momentum phase. In plain English: the indicators are not screaming “oversold bounce,” but they are also not confirming a fresh breakdown. That leaves the stock in a limbo zone where direction depends more on price action than on oscillator support.
The decisive signal comes from MACD. MACD at -16.540, below its signal line at -7.518, with a histogram of -9.022, indicates negative momentum is still dominant. The histogram being below zero means the gap between trend and signal remains adverse, so any rebound would need to prove itself before it can be treated as more than a reflex bounce. As shown in the chart, the momentum panel does not yet show a clean reversal pattern.
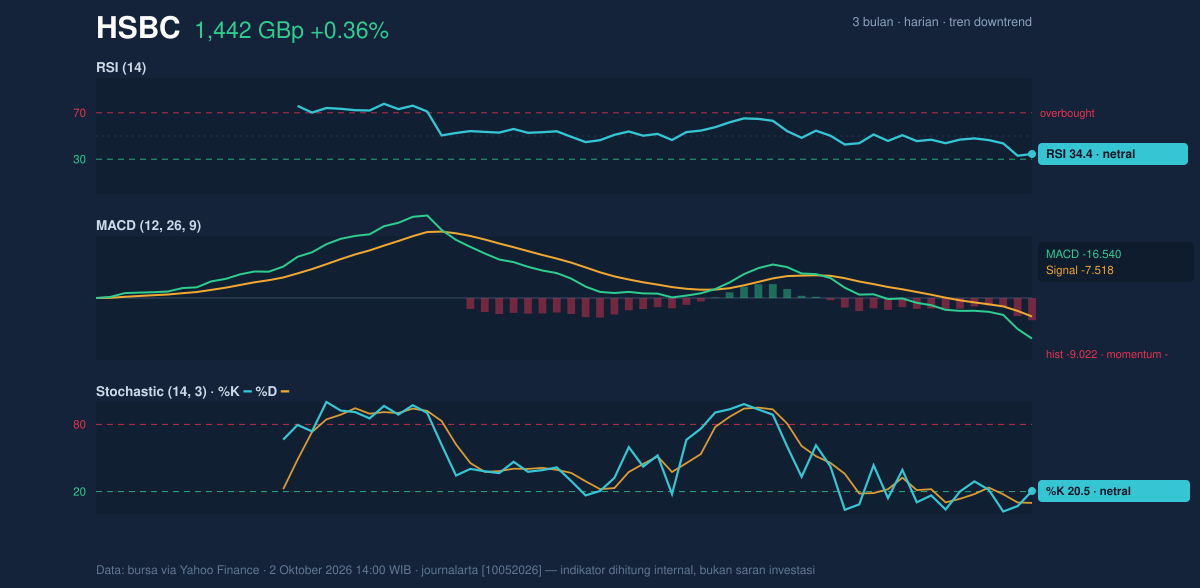
RSI is neutral, Stochastic is neutral, but MACD remains negative — and that combination usually means the market is tired, not repaired.
Volatility & Volume
Volatility is contained rather than explosive. The Bollinger band width of 9.1% points to a normal volatility regime, so HSBC is not in a squeeze that often precedes a sharp expansion. The price is near the lower band, with %B at -5%, which means it is pressing slightly beyond the lower boundary of the band structure. That often reflects short-term stress and can invite a bounce, but only if volume and momentum begin to improve. For now, the band position is more consistent with weakness than with accumulation.
Volume does not offer a strong contradiction to the bearish tone. Last volume at 19,701,653 was almost exactly in line with the 20-hour average of 19,749,231, so the move is not being driven by a dramatic surge in participation. The OBV is falling, which is important because on-balance volume tracks whether money is broadly flowing in or out. A declining OBV alongside a weak price structure suggests sellers have had the upper hand over time, even without a dramatic volume spike on the latest session.
Volume is normal, but OBV is falling — that usually means the market is not seeing sustained buying interest yet.
Key Levels & Scenarios
The key reference points are straightforward. Immediate support sits at 1,437.00, and resistance is at 1,579.00. With the share price currently close to support and still well below resistance, the market is effectively asking whether the floor can absorb another test before the next leg lower. If 1,437.00 holds, the first technical recovery zone would be the lower Bollinger area around 1,448.82, then the middle band at 1,517.80. If the stock cannot hold 1,437.00, the next area to watch is the lower end of the 3-month range near 1,350.00.
On the upside, a move back above the SMA20 at 1,517.80 would be the first sign that the short-term trend is losing its grip. A further push through 1,529.82 and then 1,579.00 would be needed before the chart begins to look less defensive. Until then, the stock remains in a technically pressured zone where rallies are more likely to be tested than trusted.
Technical Verdict: HOLD (wait & see)
HOLD (wait & see) because the chart is still in a downtrend, the death cross remains in place, and MACD is negative even though RSI and Stochastic are no longer deeply stretched. The price is also sitting close to support at 1,437.00, which makes this a decision point rather than a clean trend signal. The verdict is invalidated if price falls below 1,437.00, which would expose the lower end of the 3-month range near 1,350.00.
- Ideal Entry Range: 1,437.00 to 1,448.82
- Exit Target (Target Price): 1,517.80 to 1,529.82, with 1,579.00 as the stronger resistance test
- Stop Loss protection: below 1,437.00
In plain English: HSBC is close to support, but the chart has not yet shown enough strength to call the weakness over.
New 20-hour support remains 1,437.00.
Summary Data HSBC
| Last price | 1,442.20 GBp |
| Change 1 day / 5 days / 1 month | 0.36% / -4.63% / -8.73% |
| Trend / MA-cross | downtrend / death |
| SMA20 / SMA50 | 1,517.80 / 1,529.82 |
| RSI (14) / Stochastic %K | 34.4 / 20.5 |
| Bollinger %B / ATR | -5% / 31.26 |
| Support / Resistance 20 days | 1,437.00 / 1,579.00 |
| Data as of | 2 Oktober 2026 14:00 WIB |
Track HSBC share price daily: live levels, support/resistance and our full HSBC analysis history.



