BP Stock Technicals Today: Drops 0.94%, Momentum Gains
On September 21, 2026: price 558.70 GBp, trend uptrend, RSI 56.3, support 514.50, resistance 580.30. technical analysis of bp stock. BP Stock Technicals — full…

BP plc is holding above its short-term averages, but the share price is still trading below the upper end of its recent range. That leaves the market in a constructive but not fully stretched position, with momentum improving without yet flashing the kind of overbought signals that often precede a sharp pullback.
At 558.70 GBp, BP.L finished 0.94% lower on the day and 1.04% lower over five days, even though it remains 1.18% higher over one month. That combination matters: it suggests the recent dip is more of a pause inside a broader recovery than a clean reversal. For international readers, the key point is that BP is still trading in the upper half of its recent band, not at the edge of breakdown territory.
Trend & Price Action
The chart shows BP above both its SMA20 at 547.59 and SMA50 at 535.90, which is the clearest sign that the medium-term trend is still intact. The SMA20 is rising at 1.61% over five days, a useful signal because an upward slope in the short moving average often means buyers are still willing to step in on weakness. There is no fresh MA-cross, so the story here is not a new trend ignition; it is more about trend continuation.
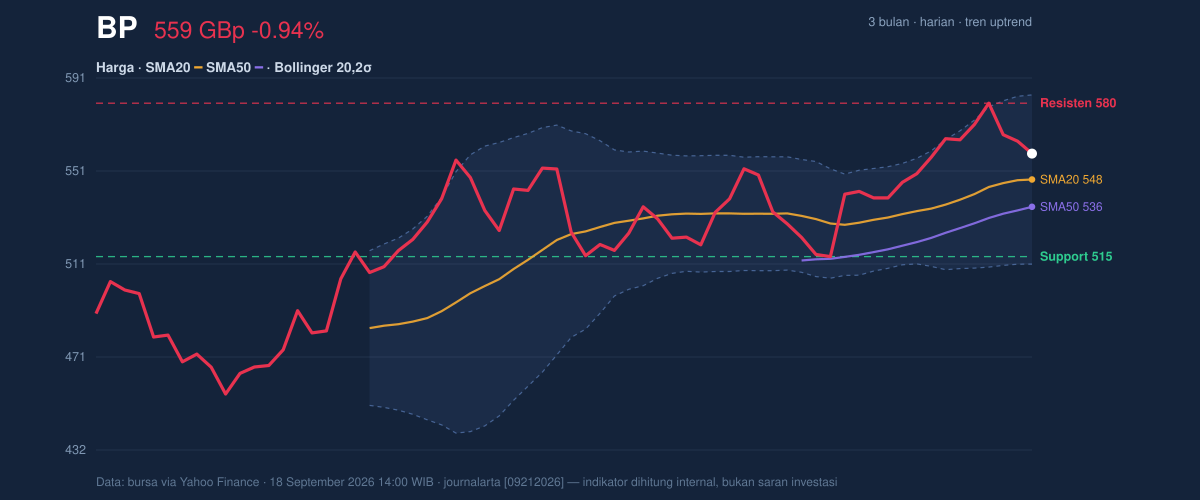
The price is also sitting at 67% of the 20-hour range, with 20-hour support at 514.50 and 20-hour resistance at 580.30. That positioning matters because it shows BP is closer to the top of the recent band than the bottom, but not yet at the ceiling. The stock is also just below its 3-month high of 582.60, which is important: when a share approaches a prior high without losing its moving-average support, the market is usually testing whether the last rally can extend or whether sellers still defend that area.
Oscillators & Momentum
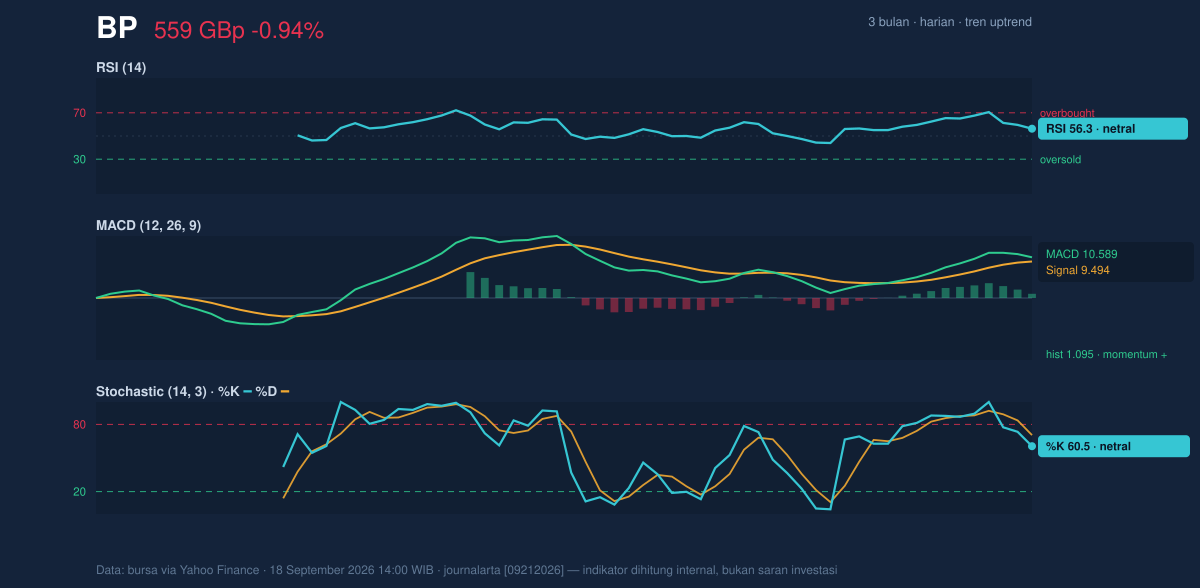
Momentum indicators are broadly supportive, but not euphoric. The RSI at 56.3 is neutral, which means BP is not overbought and still has room to advance if buyers return. The Stochastic at 60.5 / 70.4 is also neutral, though the fact that %K sits below %D suggests near-term momentum has cooled a little after the recent push higher. In plain English, the stock is still healthy, but it is not accelerating.
The more encouraging signal is the MACD at 10.589 above its signal line at 9.494, with a positive histogram of 1.095. MACD is a trend-following measure, so when it stays above the signal line it usually means upward momentum is still intact even if the pace has slowed. Put together with the rising SMA20, this argues for a market that is consolidating rather than rolling over.
Volatility & Volume
Volatility is contained. BP’s Bollinger Bands are not squeezed tightly, with a 13.3% band width, which the data classifies as normal. That matters because a normal-width band suggests the market is not primed for an explosive move purely from compression. Instead, the next move is more likely to be driven by whether price can hold above short-term support or challenge the upper band at 583.87. The %B reading of 65% reinforces that point: BP is trading in the upper portion of the band, but not at the extreme top.
The ATR at 16.91, or 3.0% of price, indicates moderate daily movement. That is enough to produce meaningful swings, but not enough to imply disorderly trading. Volume adds a constructive layer: the latest turnover of 65,910,449 shares is 1.4 times the 20-day average, and OBV is rising. Rising on-balance volume is important because it suggests money flow is still supporting the move; in other words, the recent price structure is backed by participation rather than drifting on thin trading.
Key Levels & Scenarios
The immediate battleground is clear. Support at 547.59 from the SMA20 is the first level traders will watch, while 514.50 is the deeper floor from the 20-hour range. On the upside, 580.30 is the near-term resistance, followed by the 583.87 upper Bollinger Band and the 582.60 three-month high clustered just above it. That cluster is significant because repeated failure near a prior high often tells the market is still digesting supply from earlier buyers.
If BP clears and holds above the 580.30–583.87 zone, the chart would suggest the recent consolidation has resolved to the upside. If it loses 547.59, the tone would weaken quickly because price would be slipping back under the short-term trend marker. A break below 514.50 would be more serious, as it would place the share back toward the lower part of its recent range and undermine the current uptrend structure.
Technical Verdict: HOLD (wait & see)
HOLD (wait & see)
- MACD remains positive, and the OBV trend is rising, which shows momentum and participation are still constructive.
- Price is above SMA20 and SMA50, with the SMA20 still rising, so the broader short-term trend has not broken.
- RSI and Stochastic are neutral, while price is already near the upper part of the range, so the setup is supportive but not yet decisive.
Verdict invalidated if price falls below 547.59, because that would mean BP has lost its short-term trend support.
- Ideal Entry Range: 547.59 to 514.50
- Exit Target: 580.30 to 583.87
- Stop Loss protection: below 514.50
In plain English: BP’s chart still looks constructive, but the market is waiting for either a clean push through resistance or a firmer pullback to support before the next directional move.
Summary Data BP
| Last price | 558.70 GBp |
| Change 1 day / 5 days / 1 month | -0.94% / -1.04% / 1.18% |
| Trend / MA-cross | uptrend / none |
| SMA20 / SMA50 | 547.59 / 535.90 |
| RSI (14) / Stochastic %K | 56.3 / 60.5 |
| Bollinger %B / ATR | 65% / 16.91 |
| Support / Resistance 20 days | 514.50 / 580.30 |
| Data as of | 18 September 2026 14:00 WIB |

