HSBC Testing Support Level: Stock Drops 1.61% (September 21, 2026)
On September 21, 2026: price 1,512.60 GBp, trend sideways, RSI 45.6, support 1,503.80, resistance 1,580.20. technical analysis of hsbc stock.

HSBC Holdings slipped to 1,512.60 GBp on the LSE on 18 September 2026 at 14:00 WIB, down 1.61% on the day and now trading below both the SMA20 at 1,536.22 and the SMA50 at 1,529.30. That places the shares in a cautious technical position: the medium-term trend is still described as sideways, but the price is sitting under the short-term average while momentum remains negative. The message from the chart is not collapse, but pressure — sellers are still in control of the latest leg, even as the stock stays within a broader range.
Trend & Price Action
As shown in the chart, HSBC is moving inside a sideways structure, with the SMA20 slope at 0.08%/5hari, which signals a flat market rather than a clean directional trend. The lack of a fresh MA-cross matters: there is no new moving-average crossover to confirm a trend change, so the recent weakness is more a test of support than a full breakdown. The price is also positioned near the lower part of its recent band, with the 20-hour support at 1,503.80 and resistance at 1,580.20. In plain terms, HSBC is sitting closer to the floor than the ceiling.
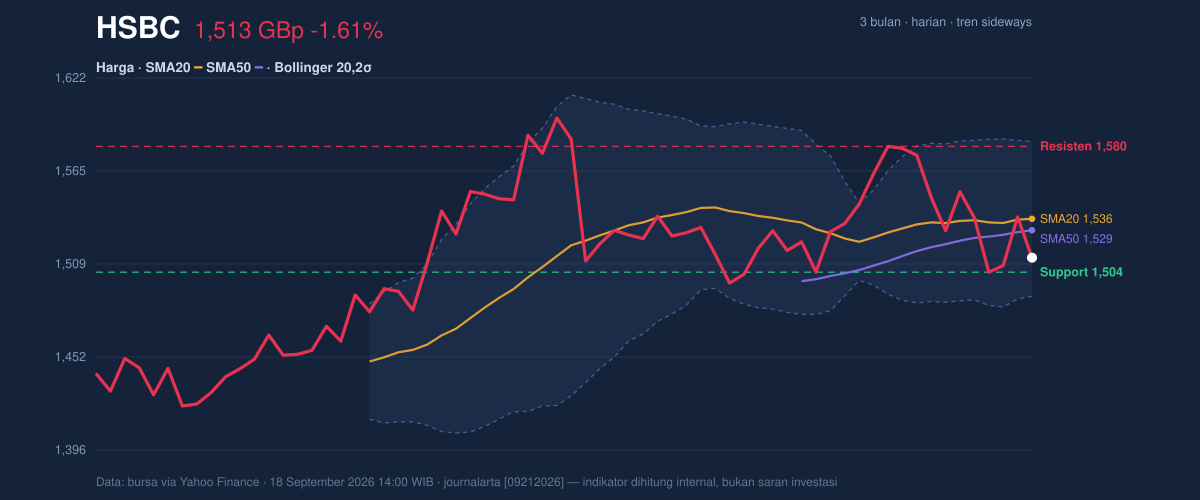
The broader 3-month range adds context. With the stock between the 3-month low of 1,350.00 and the 3-month high of 1,610.00, the market is still trading well above the lower extreme, but it has not reclaimed the upper part of the range either. That is typical of a share that is being traded tactically rather than with conviction.
A weak drift, not a trend break.
Oscillators & Momentum
The momentum picture is mixed, and that mix is important. The RSI at 45.6 is neutral, meaning the stock is neither overbought nor oversold on that measure. By itself, that suggests room for movement in either direction. But the Stochastic %K at 14.2 and %D at 22.1 point to an oversold condition, which means the latest selloff has pushed the price toward a zone where short-term rebound attempts often appear. The catch is that oversold does not mean reversal; it only means the market is stretched on the downside.
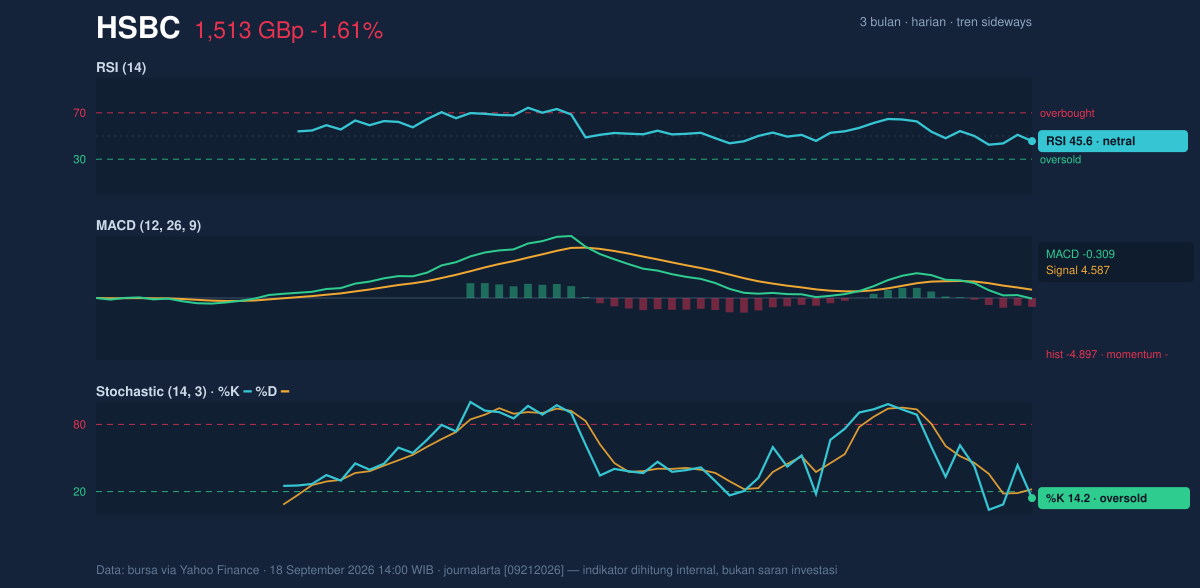
The MACD at -0.309, with the signal line at 4.587 and histogram at -4.897, is the clearest warning sign in the set. MACD is a trend-following momentum tool, and a negative reading with a deeply negative histogram says downside momentum still outweighs upside follow-through. So while Stochastic hints at exhaustion, MACD says the bears have not fully stepped aside.
That split is the key signal.
Volatility & Volume
Bollinger Bands show a market that is tightening rather than expanding. The upper band is 1,583.20, the middle band is 1,536.22, and the lower band is 1,489.24. With %B at 25%, price is sitting in the lower quarter of the band structure, close to the lower boundary but not yet pressing through it. More importantly, the band width is only 6.1% and is described as a squeeze, which usually means volatility is compressing before a sharper move. That does not tell direction, but it does tell traders to expect a more decisive break from the current quiet.
The ATR at 30.99, equal to 2.0% of price, confirms volatility is moderate rather than extreme. That matters because a squeezed Bollinger setup with a mid-range ATR often precedes a price move that can travel faster once it starts.
Volume adds another layer. Last volume was 51,220,387, versus a 20-session average of 20,032,461, a 2.6× jump. That is real participation, not a sleepy drift. But the OBV is down, which means the heavier turnover has not translated into accumulation. In other words, the market is active, but active on the wrong side for now.
Heavy volume, weak follow-through.
Key Levels & Scenarios
The nearest support to watch is 1,503.80, with the lower Bollinger band at 1,489.24 acting as the next technical floor. If price loses 1,503.80 and then slips toward 1,489.24, the chart would confirm that the squeeze is resolving to the downside. On the upside, the first meaningful barrier is 1,536.22, the SMA20 and Bollinger middle band, followed by 1,580.20. A move back above the middle band would matter because it would show the stock has reclaimed the average price area that currently caps it.
The current placement at 12% of the 20-hour range also says the stock is closer to support than resistance, which makes the next reaction around 1,503.80 especially important. If that floor holds, the oversold Stochastic could help stabilize the share price. If it fails, the market is likely to test the lower band quickly.
Technical Verdict: HOLD (wait & see)
HOLD (wait & see) fits best because the chart is caught between a weak short-term trend and an oversold oscillator setup. The evidence points in different directions: price is below the SMA20 and SMA50, MACD is negative, but Stochastic is oversold and Bollinger Bands are squeezed, which raises the chance of a sharp move rather than a smooth continuation.
- Strongest reason 1: Price below SMA20 and SMA50 keeps the near-term structure under pressure.
- Strongest reason 2: MACD negative with a deeply negative histogram shows momentum is still leaning lower.
- Strongest reason 3: Stochastic oversold and a Bollinger squeeze warn that a short-term rebound or breakout could emerge soon.
- Verdict invalidated if price breaks below 1,489.24, because that would mean the lower Bollinger band and nearby support have failed together.
- Ideal Entry Range: 1,489.24 to 1,503.80
- Exit Target: 1,536.22 to 1,580.20
- Stop Loss Protection: Below 1,489.24
In simple terms, HSBC is at a technical crossroads: the shares are weak, but the chart is compressed enough that the next move could be sharper than the last one.
Summary Data HSBC
| Last price | 1,512.60 GBp |
| Change 1 day / 5 days / 1 month | -1.61% / -2.58% / 0.67% |
| Trend / MA-cross | sideways / none |
| SMA20 / SMA50 | 1,536.22 / 1,529.30 |
| RSI (14) / Stochastic %K | 45.6 / 14.2 |
| Bollinger %B / ATR | 25% / 30.99 |
| Support / Resistance 20 days | 1,503.80 / 1,580.20 |
| Data as of | 18 September 2026 14:00 WIB |

