DIS Momentum Gains: Stock Gains 2.06% (Agustus 4, 2026)
On Agustus 4, 2026: price 98.14 USD, trend sideways, RSI 46.6, support 92.83, resistance 99.71. technical analysis of dis stock. DIS Momentum Gains — full…

Walt Disney shares rose 2.06% to 98.14 USD on 31 July 2026, recovering part of the prior month’s -1.37% slide as the stock moved back above its short-term average but still sat below a heavier overhead band near 99.15. That combination matters: it suggests the market is not in a clean uptrend, but it is also not rejecting the stock outright. Instead, Disney is trading in a narrow technical corridor where small shifts in momentum can matter more than the headline move itself.
Trend & Price Action
The chart shows Disney in a sideways pattern, with the SMA20 drifting slightly lower at -0.13% over five days. Price is above the SMA20 at 96.61, which is a modest sign of stabilization, but it remains below the SMA50 at 99.15. That gap is important because the 50-day average often acts as a broader trend filter: staying under it tells traders the stock has not yet fully repaired its medium-term structure.
There is no fresh MA cross, so the chart does not yet show a decisive trend reversal. Instead, Disney is hovering in the middle ground between short-term recovery and medium-term resistance. The stock is also trading at 77% of its 20-hour range, close enough to the top to show demand, but not so close that the move looks stretched.
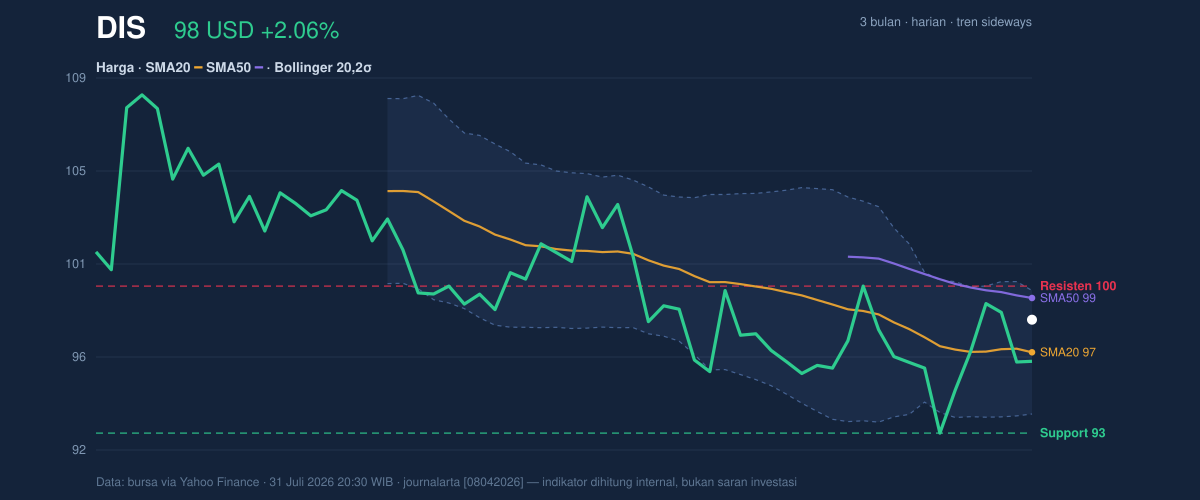
The nearest technical ceiling is 99.71, while support sits at 92.83. The 3-month range adds context: Disney is well below the 110.48 high, but still above the 92.49 low. That positioning says the share price is not in free fall; rather, it is consolidating after a larger retreat and trying to build a base.
A base is not a breakout.
Oscillators & Momentum
Momentum indicators are aligned, but only mildly. The RSI at 46.6 is neutral, which means the stock is neither overbought nor oversold. In plain language, there is no strong emotional excess in the market right now. The Stochastic %K at 50.3 and %D at 60.5 are also neutral, though the %K sitting below %D suggests the rebound has not fully regained short-term control.
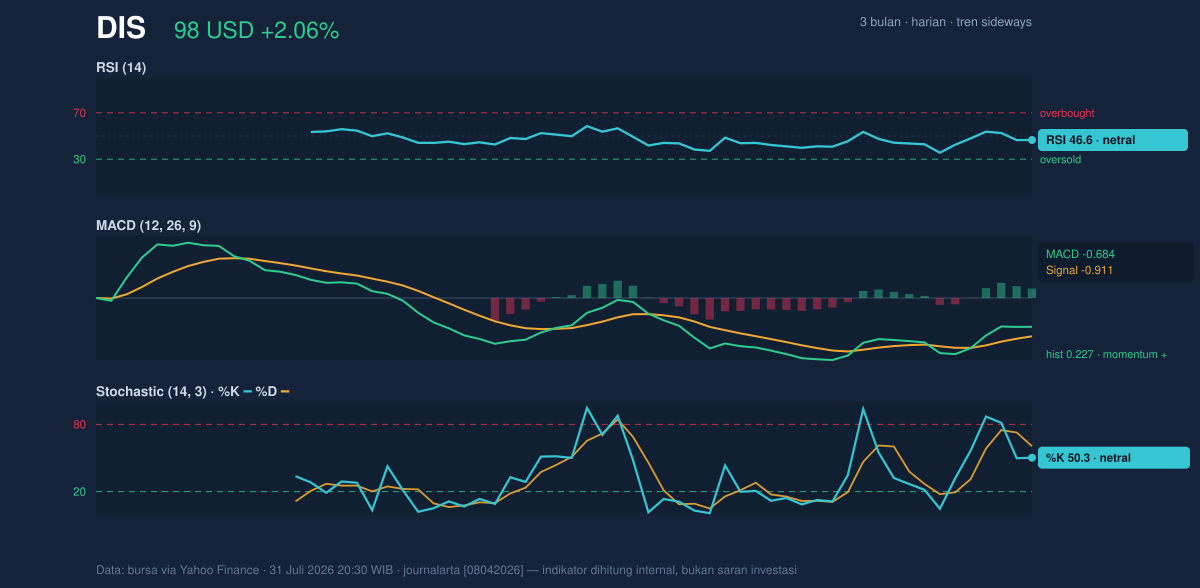
The more constructive signal comes from the MACD at -0.684, with the signal line at -0.911 and a positive histogram of 0.227. That setup means downside momentum is easing even though the indicator remains below zero. In chart terms, the stock is still technically in a weak phase, but the pace of weakness is slowing. That is often what a base looks like before either a breakout or another failed attempt.
Volatility & Volume
Bollinger Bands are telling a useful story. The upper band is 99.50, the middle band is 96.61, and the lower band is 93.72. Price at 98.14 sits above the midline and near the upper half of the envelope, with %B at 76%. That means the stock is leaning toward the upper side of its recent volatility range, but not yet pressing the top band hard enough to look overheated.
The band width is only 6.0%, described here as a squeeze. A squeeze matters because it often precedes a larger move; the market is compressing price action, which can store energy for a later expansion. The direction of that expansion is not guaranteed, but the setup usually warns that the next meaningful move may be larger than the recent daily changes.
ATR at 2.31, or 2.4% of price, points to moderate volatility. That means Disney is moving enough to matter, but not with the kind of disorder that usually marks capitulation. Volume was 11,193,000, just above the 10,795,410 20-day average, so the latest rise had participation, but not the kind of surge that would strongly validate a trend change. The weaker clue is OBV, which is falling. OBV, or on-balance volume, tracks whether volume is accumulating on up days or leaking away over time; a decline there suggests buyers have not yet fully taken command.
Key Levels & Scenarios
The immediate map is straightforward. 99.71 is the first resistance to watch, closely followed by the 99.50 Bollinger upper band and the 99.15 SMA50. Those three levels cluster tightly, so Disney needs to clear a small wall of supply rather than a single line in the sand.
Below, 96.61 is the SMA20 and the Bollinger midline, making it the first layer of support. If that gives way, the chart points toward 93.72 at the lower Bollinger band and then 92.83 at 20-hour support. The 92.49 three-month low sits just beneath that zone and would matter because it would place the stock back near the lower end of its recent trading range.
The signal is therefore conditional: holding above the mid-band keeps the recovery attempt alive, but failure to defend it would expose the stock to a retest of the lower range. The chart is balanced, not resolved.
Technical Verdict: HOLD (wait & see)
HOLD (wait & see) fits best because the indicators are improving, but not enough to confirm a trend reversal.
- MACD histogram is positive, showing momentum is improving even though the MACD line remains below zero.
- Price is above the SMA20 and Bollinger midline at 96.61, which supports the current rebound.
- RSI at 46.6 and Stochastic at 50.3 / 60.5 are neutral, so the move lacks strong confirmation.
- OBV is falling, which warns that the latest strength has not yet been backed by sustained accumulation.
Verdict invalidated if price breaks below 93.72, because that would put Disney through the lower Bollinger band and weaken the current base structure.
- Ideal Entry Range: 96.61 to 93.72
- Exit Target: 99.50 to 99.71
- Stop Loss Protection: below 92.83
For non-traders, this means Disney is trying to stabilize, but the chart still needs proof that the recovery can last.
“The stock is trying to turn the corner, but the market has not yet given it a clean green light.”
Summary Data DIS
| Last price | 98.14 USD |
| Change 1 day / 5 days / 1 month | 2.06% / 3.47% / -1.37% |
| Trend / MA-cross | sideways / none |
| SMA20 / SMA50 | 96.61 / 99.15 |
| RSI (14) / Stochastic %K | 46.6 / 50.3 |
| Bollinger %B / ATR | 76% / 2.31 |
| Support / Resistance 20 days | 92.83 / 99.71 |
| Data as of | 31 Juli 2026 20:30 WIB |
Track DIS stock price daily: live levels, support/resistance and our full DIS analysis history.


