ORCL Stock Gains 11.20%, Momentum Gains In Focus
On Agustus 4, 2026: price 141.85 USD, trend sideways, RSI 43.8, support 114.99, resistance 144.22. technical analysis of orcl stock. ORCL Stock Gains — full…

Oracle is trading in a tension zone where a sharp rebound is colliding with a still-weakened medium-term trend, leaving the stock close to resistance even after a powerful one-day jump.
Oracle (NYSE: ORCL) last traded at 141.85 USD, up 11.20% on the day after a prior close of 127.56, according to market data via Yahoo Finance. That move matters because it lifted the shares back toward the top of the recent trading band, but it did not erase the broader message from the chart: the stock remains in a sideways pattern, with the SMA20 at 128.88 still below price, while the SMA50 at 164.92 sits well overhead. In plain terms, Oracle has recovered from weakness, but it has not yet rebuilt a clean medium-term uptrend.
Trend & Price Action
The price structure is the key story here. Oracle is trading above the SMA20, which is usually a sign that short-term buyers have regained some control. But the trend is still described as sideways, and the SMA20 slope is -4.11% over 5 days, meaning the short-term average is still pointing lower even as the share price bounces. That combination often signals a market that is reacting to fresh demand, but has not yet proven that the rebound can sustain itself.
The stock is also sitting close to the upper end of its recent range. The 20-hour resistance is 144.22, while the 20-hour support is 114.99. At 92% of the range, Oracle is trading near the top of that band, which means the market is already pricing in a good deal of the rebound. The 3-month low of 114.50 shows where buyers previously stepped in; the 3-month high of 250.25 shows just how far the stock remains from its earlier peak.
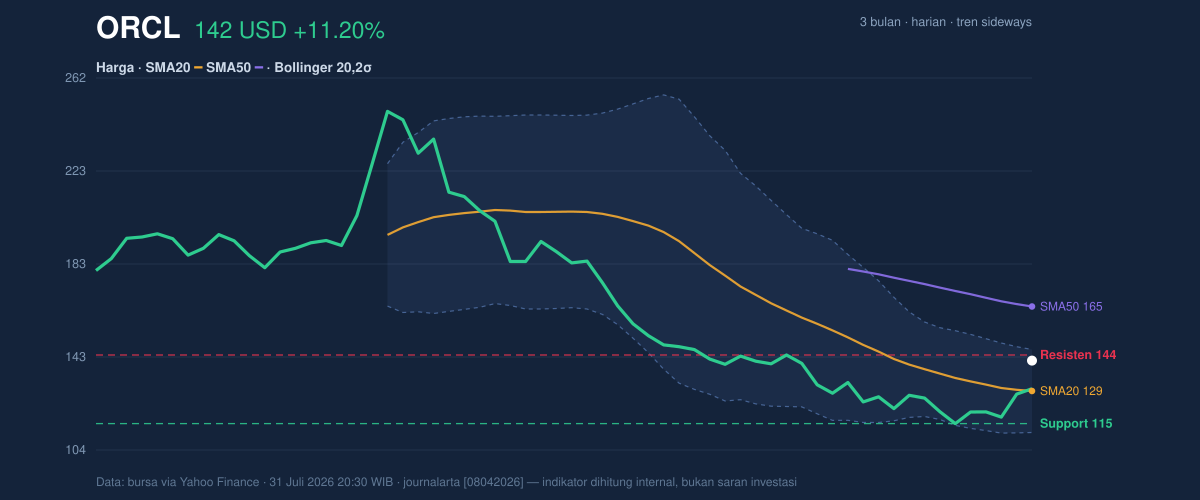
The chart suggests a market that is testing the ceiling, not breaking into open air.
Oscillators & Momentum
Momentum indicators are less dramatic than the price move, which is important. The RSI at 43.8 is neutral, not overbought and not oversold. That means the stock has room to move either way, but it also tells us the rally has not yet reached the kind of stretched condition that often warns of exhaustion. The Stochastic %K at 79.2 versus %D at 47.2 is more aggressive: %K is near the upper end of its scale, suggesting short-term momentum has improved quickly. But because the broader setup is still neutral, this looks more like an early rebound than a fully confirmed trend shift.
The most constructive signal comes from MACD. Oracle’s MACD is -10.795, above the signal line at -13.166, with a histogram of 2.372. In simple terms, the MACD is still below zero, so the stock has not fully escaped prior weakness, but the positive histogram shows momentum is improving. That often means the downside force is fading before the trend itself turns decisively upward.
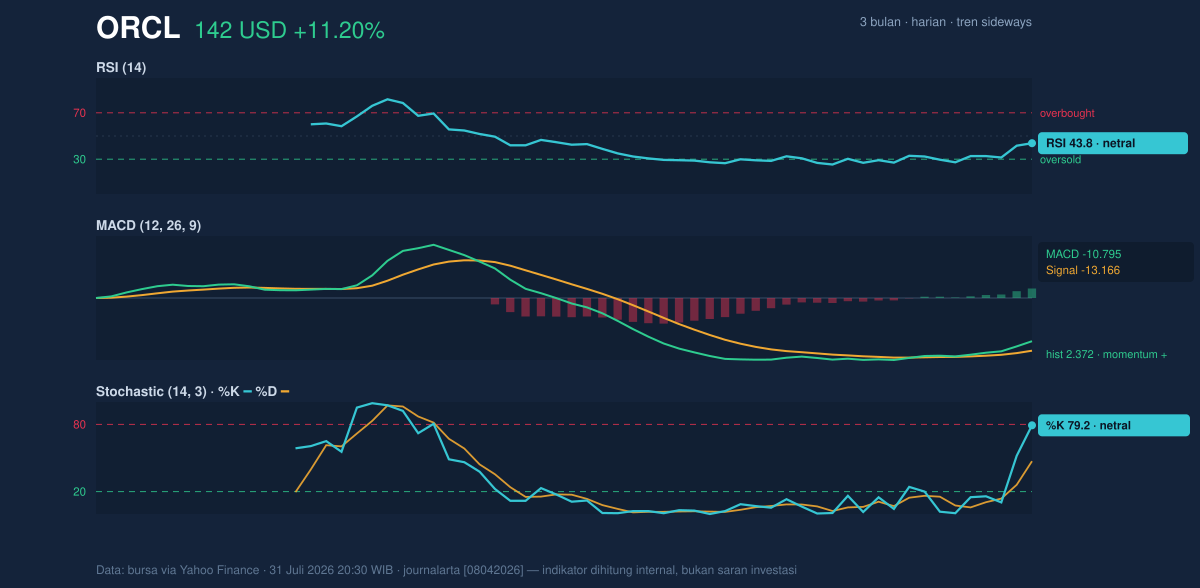
So the momentum picture is improving, but not yet decisive.
Volatility & Volume
Volatility is elevated, and that matters because sharp rebounds can reverse just as quickly. The Bollinger upper band at 146.59 is now close to the current price, while the middle band at 128.88 aligns with the SMA20 and the lower band at 111.18 marks the downside boundary. With %B at 87%, Oracle is trading near the upper part of its Bollinger envelope, which usually means the stock is pressing into a zone where follow-through becomes harder and short-term pullbacks become more likely if buyers pause.
The Bollinger band width of 27.5% shows the bands are expanding, a sign that volatility is rising rather than compressing. That often precedes larger price swings in either direction. The ATR at 6.86, equal to 4.8% of price, confirms that daily movement is elevated. For readers unfamiliar with ATR, it is a measure of how much a stock typically moves in a session; a higher reading means wider swings and less stability.
Volume is more mixed. The latest volume of 34,438,700 is only 0.9x normal versus the 20-hour average of 38,625,990, so the rally did not arrive with a clear surge in participation. That tempers the strength of the move. Still, OBV is rising, and that is constructive because on-balance volume tracks whether buying pressure is building over time. In other words, even if the day’s turnover was not exceptional, the broader accumulation signal is improving.
A rally without heavy volume can still hold — but it is easier to question.
Key Levels & Scenarios
The first level to watch is 144.22, the 20-hour resistance. A clean push through that area would place Oracle closer to the 146.59 Bollinger upper band, which is the next obvious technical ceiling. If that zone is rejected, the stock may drift back toward the 128.88 middle band, where the short-term trend and the average price are anchored. Below that, 114.99 is the key support from the 20-hour range, with 111.18 as the lower Bollinger boundary.
The setup is therefore conditional: if Oracle can hold above the middle band and keep pressure near resistance, the rebound remains intact; if it slips back below the middle band, the move starts to look more like a fast oversold bounce than a trend change.
Technical Verdict: HOLD (wait & see)
HOLD (wait & see) fits best because Oracle’s price action is strong, but the broader trend is still sideways and the stock is already pressing into resistance with only neutral-to-improving momentum.
Why this verdict stands:
- MACD histogram is positive, showing momentum is improving, but MACD itself remains below zero.
- RSI at 43.8 is neutral, so the rally is not yet confirmed by momentum breadth.
- Price is near resistance at 144.22 and close to the 146.59 Bollinger upper band, where upside often becomes harder to sustain.
Verdict invalidated if price breaks below 114.99, because that would mean the current rebound has failed to defend the key 20-hour support.
- Ideal Entry Range: 128.88 to 144.22
- Exit Target: 146.59
- Stop Loss protection: 114.99
For non-traders: Oracle has bounced hard, but the chart still needs more proof before this move can be treated as durable.
“It’s a relief rally until the market proves otherwise.”
Summary Data ORCL
| Last price | 141.85 USD |
| Change 1 day / 5 days / 1 month | 11.20% / 23.36% / 1.13% |
| Trend / MA-cross | sideways / none |
| SMA20 / SMA50 | 128.88 / 164.92 |
| RSI (14) / Stochastic %K | 43.8 / 79.2 |
| Bollinger %B / ATR | 87% / 6.86 |
| Support / Resistance 20 days | 114.99 / 144.22 |
| Data as of | 31 Juli 2026 20:30 WIB |
Track ORCL stock price daily: live levels, support/resistance and our full ORCL analysis history.


