PANW Stock Analysis: Gains 6.59%, Momentum Weakens
On Agustus 4, 2026: price 347.13 USD, trend sideways, RSI 54.9, support 314.15, resistance 358.68. technical analysis of panw stock. PANW Stock Analysis — full…

Palo Alto Networks rose to 347.13 USD on NASDAQ, up 6.59% from the previous close of 325.68, but the move sits inside a broader pause rather than a clean breakout. The stock is trading above its short- and medium-term averages, yet the message from momentum is less convincing than the price alone suggests.
Trend & Price Action
The first thing the chart shows is that PANW is still holding above its SMA20 at 335.64 and well above its SMA50 at 305.27. That matters because it keeps the medium-term structure constructive: buyers have not lost control of the longer trend even though the stock has been moving sideways. The lack of a fresh MA-cross also signals no new trend regime has formed; this is more consolidation than acceleration.
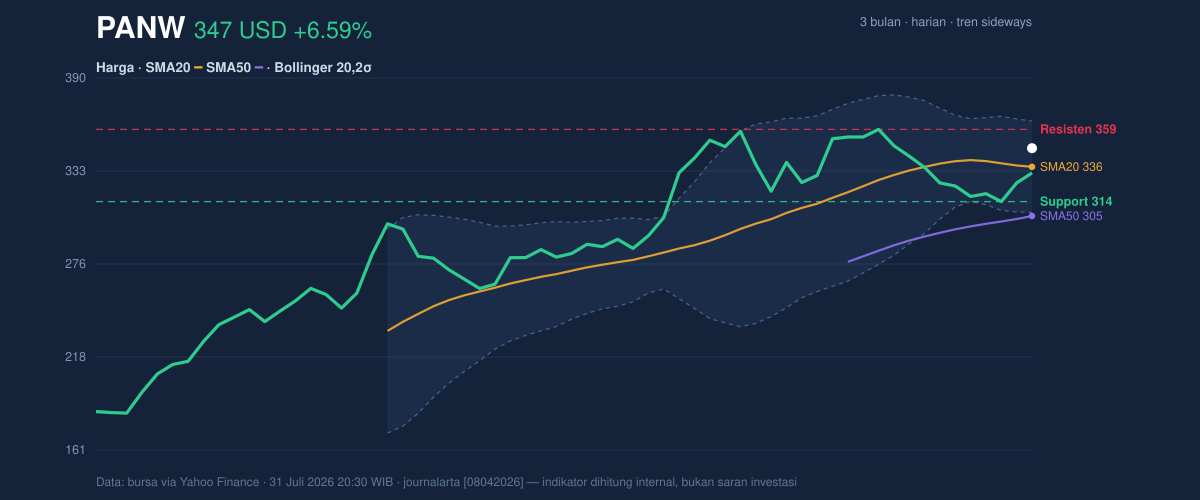
The stock’s position inside the recent range is also important. At 347.13, PANW is sitting around 74% of the way through its 20-day range between 314.15 support and 358.68 resistance. In plain terms, the shares are closer to the upper boundary than the lower one, but not yet close enough to say the ceiling has been cleared. That leaves the market in a wait-and-prove phase. The broader three-month range, from 179.19 to 368.80, shows how much ground the stock has already recovered, but also how near it is to an older high that could attract selling.
The sideways trend label is reinforced by the SMA20 slope of -1.02% over 5 days. That negative tilt means the short-term average is easing lower even while price remains above it. In other words, the stock is holding up better than its average, but the average itself is not yet turning convincingly upward.
Oscillators & Momentum
Momentum is the part of the picture that keeps this from looking like a straightforward breakout. The RSI at 54.9 is neutral, which tells us the stock is neither stretched nor oversold. That is usually a sign of balance, not urgency. The Stochastic %K at 38.6 and %D at 25.5 also sit in neutral territory, suggesting the recent rebound has room to continue, but not enough confirmation to call it strong.
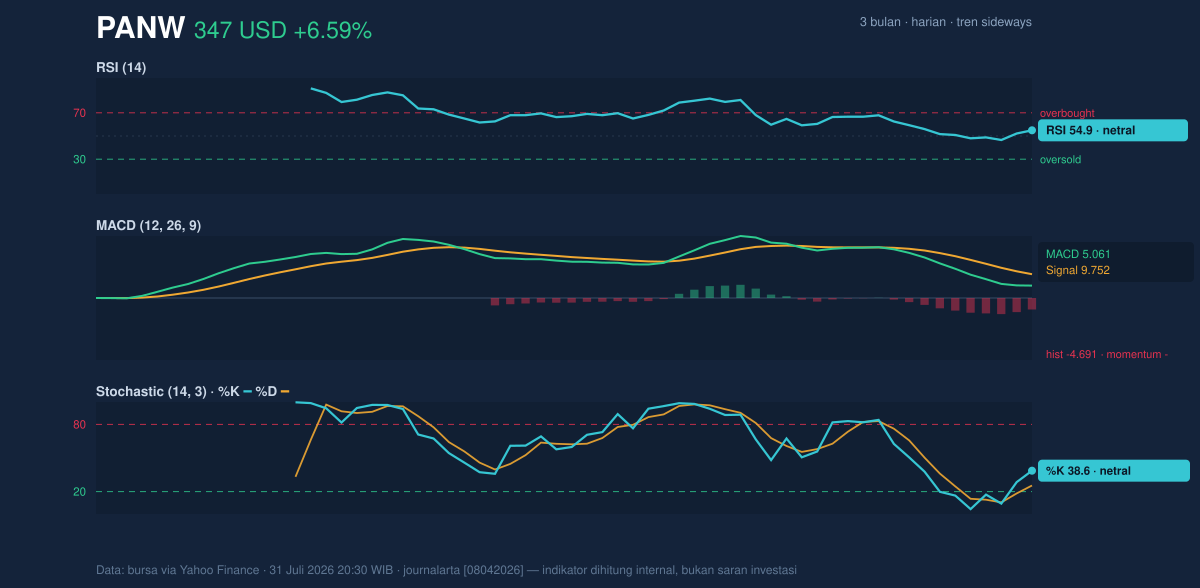
The more cautionary signal comes from MACD. With MACD at 5.061 below the signal line at 9.752, and a histogram of -4.691, short-term momentum is still negative. That histogram is the key clue: it means the faster trend is lagging the slower one, so the price recovery has not yet translated into confirmed upside momentum. For readers, this is the difference between a stock that is rising and a stock that is truly gathering force.
Volatility & Volume
Volatility remains elevated. The ATR(14) at 15.30 equals 4.4% of price, which means daily swings can be meaningful even without a broad trend change. The Bollinger Bands show the stock trading in the upper half of its recent volatility envelope, with %B at 70%. That suggests price is leaning toward the upper band at 363.86, but not pressing it hard enough to indicate a breakout already underway.
The Bollinger band width of 16.8% is normal, so this is not a compression setup that usually precedes a large move. Instead, the bands imply a fairly standard trading environment where price can drift or whipsaw without much warning.
Volume is the other caution flag. Last trade volume of 5,027,700 was only 0.8× the 20-day average of 6,581,885, while OBV is falling. That combination matters: price can rise on light participation, but if volume is below average and OBV is declining, the rally is less likely to reflect broad accumulation. In simple terms, the move has not yet attracted enough conviction from the market.
Key Levels & Scenarios
The near-term technical map is clear. 314.15 is the first support to watch; a failure there would weaken the current base and suggest the rebound is losing shape. Above the market, 358.68 is the immediate resistance, and then 363.86 marks the upper Bollinger band. A close through that zone would matter because it would show PANW is not just drifting higher inside a range but challenging the top of its recent volatility structure.
The broader context is the 368.80 three-month high. That level is close enough to act as a psychological ceiling, especially with MACD still negative and volume below average. If price cannot hold above 335.64, the SMA20 itself becomes a reference point for whether the recent bounce was only a pause inside a larger sideways pattern.
Technical Verdict: HOLD (wait & see)
HOLD (wait & see)
- RSI at 54.9 and Stochastic at 38.6 / 25.5 are neutral, so momentum is not strong enough to confirm a decisive trend.
- MACD remains below the signal line with a -4.691 histogram, which warns that upside is still unconfirmed.
- Volume is 0.8× normal and OBV is down, so the latest rise lacks strong participation.
Verdict invalidated if price falls below 314.15.
- Ideal Entry Range: 335.64 to 347.13, where price sits near the SMA20 and above short-term support
- Exit Target: 358.68 to 363.86, aligning with resistance and the upper Bollinger band
- Stop Loss: below 314.15, the nearest defined support
For non-traders: PANW is holding up, but the chart still wants proof that the rebound has real force behind it.
“We’re not seeing the volume yet,” one market participant said, pointing to the stock’s muted turnover against a rising price.
Summary Data PANW
| Last price | 347.13 USD |
| Change 1 day / 5 days / 1 month | 6.59% / 7.21% / -0.27% |
| Trend / MA-cross | sideways / none |
| SMA20 / SMA50 | 335.64 / 305.27 |
| RSI (14) / Stochastic %K | 54.9 / 38.6 |
| Bollinger %B / ATR | 70% / 15.30 |
| Support / Resistance 20 days | 314.15 / 358.68 |
| Data as of | 31 Juli 2026 20:30 WIB |
Track PANW stock price daily: live levels, support/resistance and our full PANW analysis history.


