Alibaba Stock Analysis: Drops 1.11%, Golden Cross Formed
On Agustus 7, 2026: price 124.40 HKD, trend uptrend, RSI 69.2, support 108.00, resistance 128.10. technical analysis of alibaba stock. Alibaba Stock Analysis —…

Alibaba Group’s Hong Kong-listed shares fell 1.11% to 124.40 HKD on the latest session, according to data from Yahoo Finance, even as the stock remains in a clear uptrend and trades just below a nearby ceiling that has started to matter more than the day’s pullback.
The move is small in isolation, but it is telling. Alibaba is still sitting above both its SMA20 of 114.97 and SMA50 of 111.50, with the shorter average already above the longer one in a golden cross formation. That is the classic technical sign that medium-term buyers have taken control, while the 5.51% rise in the SMA20 over the past 5 days shows the trend is not just intact but steepening. In plain language: the stock has been climbing fast enough that the market is now testing whether momentum can keep carrying it higher without a pause.
What matters next is where price sits inside the recent range. At 124.40 HKD, Alibaba is trading at about 82% of its 20-hour range between 108.00 support and 128.10 resistance, which means it is closer to the top than the bottom. That positioning usually signals strength, but also a narrower margin for error. The chart shows the share price pressing into the upper band of its recent structure, and that is where short-term traders often begin watching for either a clean breakout or a stall.
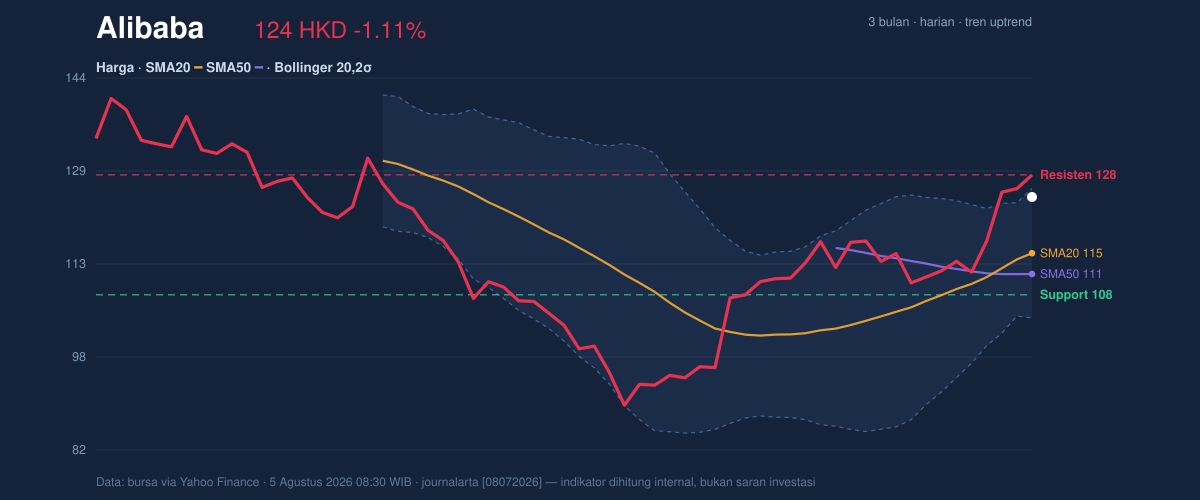
The Bollinger Bands reinforce that tension. Alibaba’s price is near the upper band at 125.81, with %B at 93%, meaning the stock is trading very close to the top of its recent volatility envelope. That does not automatically mean reversal; it means the market is already pricing in a lot of upside momentum. The band width is 18.9%, described as normal, so this is not a squeeze setup where a major expansion is being telegraphed in advance. Instead, the message is simpler: the stock has room to move, but it is already extended relative to its recent average. ATR(14) at 5.24, or 4.2% of price, confirms that daily swings are still sizable. In other words, Alibaba can move quickly in either direction once the market chooses a side.
Volume and participation complicate the picture slightly. The latest turnover of 93,382,622 shares is below the 20-hour average of 112,466,152, or about 0.8x normal. That means the latest advance is not being backed by exceptional trading activity, which can make an upward push less decisive near resistance. Still, OBV is rising, and that matters because on-balance volume tracks whether money is generally flowing into the stock over time. Rising OBV alongside a price uptrend suggests the broader bid remains intact, even if the latest session was quieter than average.
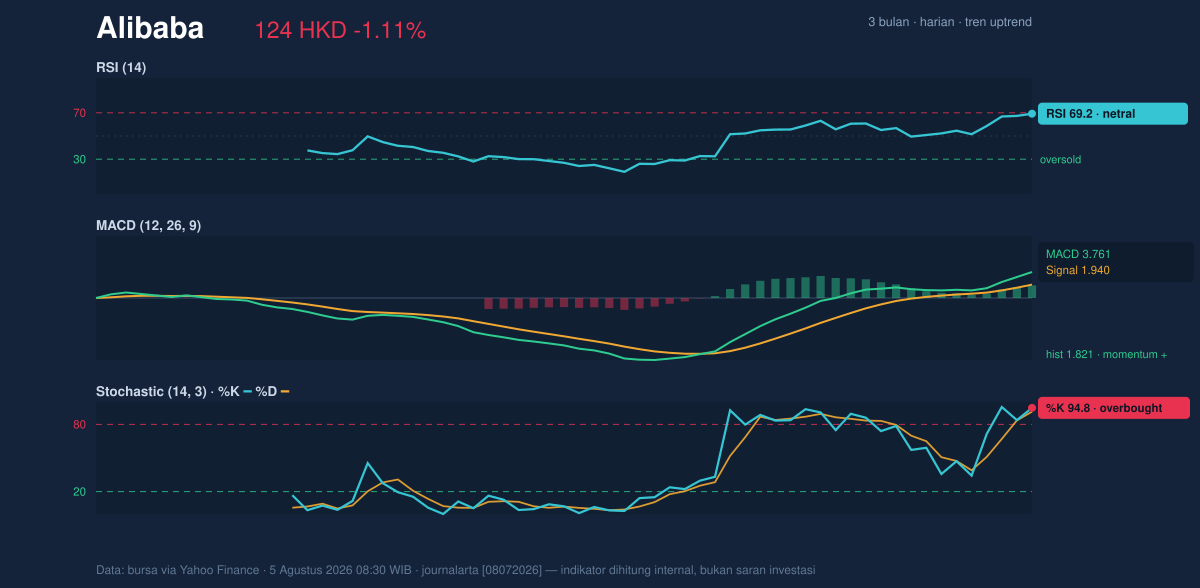
The momentum tools are mixed in a way that usually signals a late-stage trend rather than a fresh launch. RSI at 69.2 is described as neutral, but it is close enough to the overbought zone to show the stock is running hot. More importantly, the Stochastic %K at 94.8 and %D at 91.4 are both clearly overbought, which means the recent closing prices are clustered near the top of their range. That often happens when buyers remain in control, but it also warns that upside may need a pause to reset. The MACD at 3.761, above its signal line at 1.940 with a positive histogram of 1.821, shows trend momentum is still aligned with the uptrend. On the momentum chart, the key signal is not that Alibaba is weak; it is that strength is already stretched.
The 3-month range adds context. Alibaba is well above the 3-month low of 88.65 but still below the 3-month high of 144.00, so the recovery is substantial but incomplete. That matters because the stock is not chasing a new high from an exhausted base; it is advancing within a broader recovery arc. The immediate question is whether 128.10 resistance gives way cleanly or whether the stock first revisits the 114.97 SMA20 area, which now doubles as both trend support and the Bollinger middle band.
Technical Verdict: HOLD (wait & see)
HOLD (wait & see) fits the current setup because the trend is constructive, but the stock is also stretched near resistance and showing overbought momentum. Golden cross and the rising SMA20 support the broader trend, while MACD remains positive and OBV is rising, showing participation has not broken down. At the same time, Stochastic is overbought and price is near the upper Bollinger band, which raises the odds of a pause before any further advance.
- Ideal Entry Range: 114.97 HKD to 118.00 HKD, where the SMA20 and Bollinger middle band sit, or on a confirmed push above 128.10 HKD with follow-through
- Exit Target: 128.10 HKD first, then the 144.00 HKD 3-month high if resistance breaks decisively
- Stop Loss protection: 108.00 HKD, the 20-hour support level
This verdict is invalidated if price breaks below 108.00 HKD, because that would weaken the current trend structure and put the recent breakout pattern under pressure.
For non-traders: Alibaba is still trending higher, but it is close enough to resistance that the next move matters more than the last one.
Latest 20-hour support: 108.00 HKD.
Summary Data Alibaba
| Last price | 124.40 HKD |
| Change 1 day / 5 days / 1 month | -1.11% / 9.51% / 15.72% |
| Trend / MA-cross | uptrend / golden |
| SMA20 / SMA50 | 114.97 / 111.50 |
| RSI (14) / Stochastic %K | 69.2 / 94.8 |
| Bollinger %B / ATR | 93% / 5.24 |
| Support / Resistance 20 days | 108.00 / 128.10 |
| Data as of | 5 Agustus 2026 08:30 WIB |

