AIA Stock Technicals Today: Drops 1.16%, Momentum Weakens
On Agustus 19, 2026: price 72.55 HKD, trend sideways, RSI 41.6, support 70.40, resistance 79.65. technical analysis of aia stock. AIA Stock Technicals — full…

AIA Group slipped to 72.55 HKD on HKEX, down 1.16% from the previous close of 73.40, and the move matters less for the size of the drop than for where it leaves the stock: below both its short- and medium-term averages, with momentum still soft and volume not yet strong enough to argue that sellers are exhausted. As shown in the chart, the price is sitting in the lower part of its recent range, a position that often signals caution rather than outright panic. The technical picture is not broken in a dramatic way, but it is leaning defensive.
Trend & Price Action
The first signal is the trend itself. The stock is described as sideways, but that label hides an important detail: the SMA20 at 75.85 is above the current price, and the SMA50 at 74.51 is also overhead. That means recent trading has been weaker than the average of both the last month and the last few months, which usually tells traders that rallies have been fading before they can reassert control. The SMA20 slope of -1.24% over 5 days reinforces that point. A falling short-term average is often the chart’s way of showing that the market has been leaning lower even without a clean breakdown.
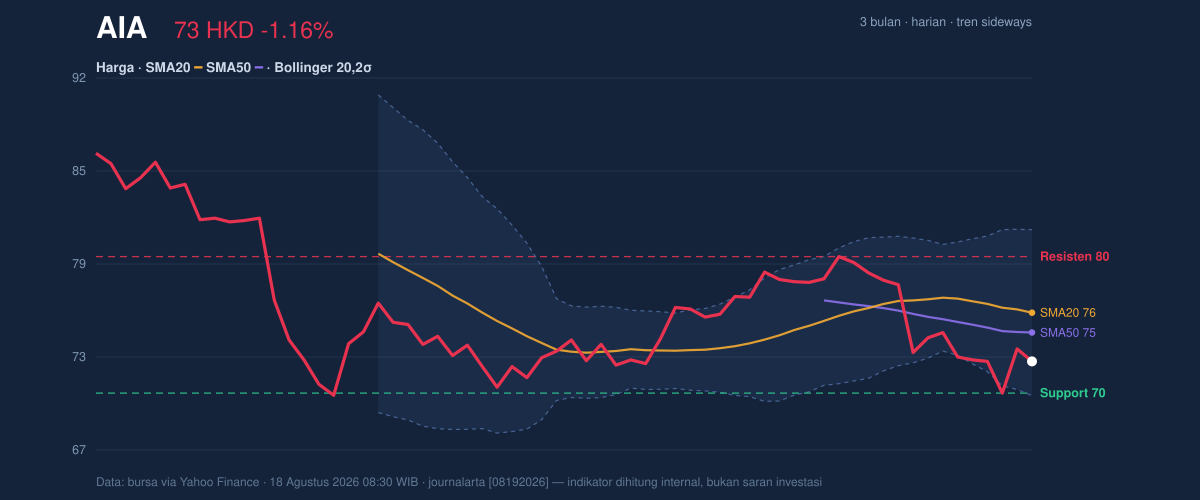
The Bollinger Bands add context. With the lower band at 70.23, middle band at 75.85, and upper band at 81.48, the stock is trading below the midpoint and closer to the lower edge of its normal envelope. The %B at 21% means the price is near the lower quarter of the band structure, which is a technical sign of weakness, but not necessarily a collapse. The 14.8% band width is marked as normal, so this is not a volatility squeeze that often precedes a sharp expansion. Instead, the market looks orderly, with pressure tilted downward rather than explosive.
The broader range matters too. The stock is trading at about 23% of the 20-hour range, between 70.40 support and 79.65 resistance. That placement tells you the market is closer to support than resistance, but not yet at a level that suggests a strong rebound has started. The three-month range of 69.05 to 87.40 shows that the current price is nearer the bottom of that span, which can attract attention from traders watching for value, though the chart has not yet confirmed that interest.
Oscillators & Momentum
As shown in the chart, momentum is mixed but still negative. The RSI(14) at 41.6 is neutral, which means the stock is not oversold in the classic sense. That matters because a neutral RSI does not yet provide the kind of technical exhaustion signal that often precedes a cleaner rebound. The Stochastic %K at 23.6 and %D at 19.3 are also neutral, but they sit near the lower end of the scale, suggesting the stock is weak without being stretched to an extreme. In plain language, the oscillator set is saying that AIA is soft, but not so weak that a snapback is guaranteed.
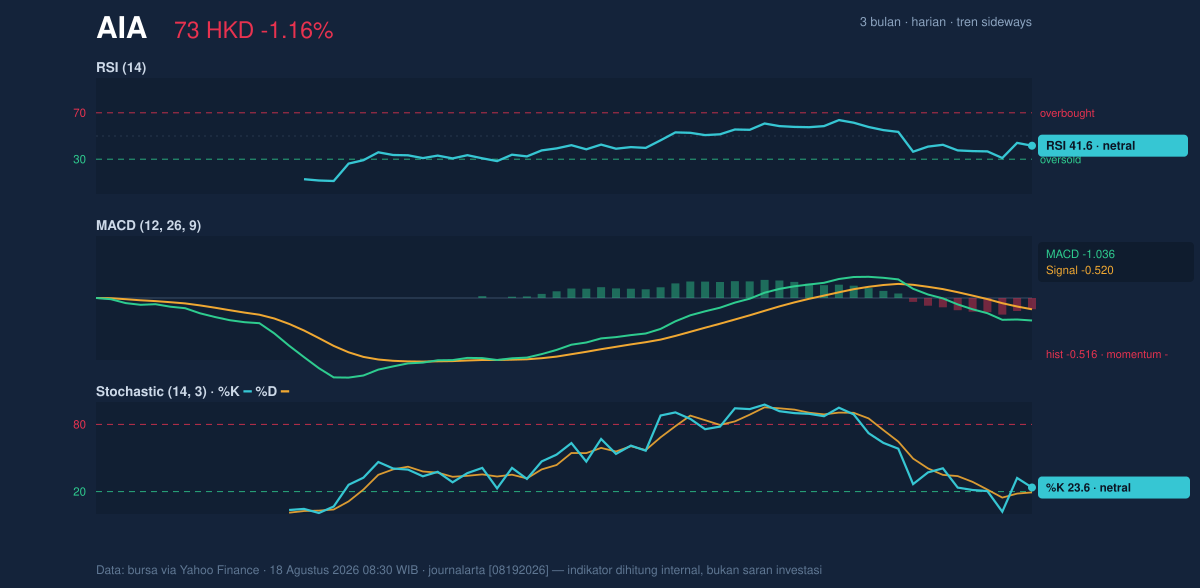
The sharper warning comes from MACD. The MACD at -1.036, below the signal line at -0.520, with a histogram of -0.516, shows bearish momentum remains in place. This is important because MACD is less about where the stock is today and more about whether the trend is improving or deteriorating. Here, it is still deteriorating. The histogram being negative means the gap between the MACD line and signal line remains unfavorable, so any bounce would need follow-through before it can be treated as more than a short-term reaction.
Volatility & Volume
Volatility is moderate rather than elevated. The ATR(14) of 2.24, equal to 3.1% of price, suggests the stock can still move meaningfully in a session, but not with the kind of disorder that usually accompanies panic selling. That leaves room for range trading. The issue is participation. Volume came in at 26,581,511, below the 20-session average of 29,068,786, or 0.9× normal. Lower-than-average volume on a down move often signals that conviction is limited, but it also means buyers have not stepped in with enough force to reverse the tone.
OBV, or on-balance volume, is falling. That matters because OBV tracks whether volume is supporting price direction. A declining OBV alongside a price below both moving averages usually suggests distribution is still edging ahead of accumulation. In simple terms, more volume has been attached to the weaker side of the move than to the stronger side.
Key Levels & Scenarios
The chart points to 70.40 as the immediate support to watch. That level sits just above the 3-month low of 69.05, so a clean break below it would put the stock back into the lower boundary of its longer range and would raise the risk that recent weakness is not just a pause. On the upside, 74.51 and 75.85 are the first technical hurdles because they line up with the SMA50 and SMA20. Above that, 79.65 resistance marks the next barrier where rallies have room to stall.
If price holds above 70.40 and reclaims 74.51, the chart would begin to shift from defensive to stabilizing. If it fails to hold 70.40, the market would be signaling that the lower band area is not enough to contain selling pressure. The current structure leaves little room for complacency: the stock is near support, but the moving averages and MACD are still working against it.
Technical Verdict: HOLD (wait & see)
HOLD (wait & see) fits the present setup because the price is below SMA20 75.85 and SMA50 74.51, MACD remains negative, and volume is only 0.9× normal, so there is not yet enough confirmation that the downshift is ending. At the same time, the stock is close to 70.40 support and not far above the 69.05 three-month low, which leaves room for a stabilizing reaction if selling pressure eases.
- Ideal Entry Range: 70.40 to 74.51, where support and the SMA50 begin to overlap.
- Exit Target: 75.85, with a secondary technical level at 79.65 if momentum improves.
- Stop Loss protection: below 70.40, with the chart weakening further if 69.05 gives way.
In plain English, the stock is weak but not broken, and the chart is waiting for proof that buyers can defend support before the next move matters.
Newest fact: volume on the last session was 26,581,511 against a 20-session average of 29,068,786.
Summary Data AIA
| Last price | 72.55 HKD |
| Change 1 day / 5 days / 1 month | -1.16% / -0.41% / -5.72% |
| Trend / MA-cross | sideways / none |
| SMA20 / SMA50 | 75.85 / 74.51 |
| RSI (14) / Stochastic %K | 41.6 / 23.6 |
| Bollinger %B / ATR | 21% / 2.24 |
| Support / Resistance 20 days | 70.40 / 79.65 |
| Data as of | 18 Agustus 2026 08:30 WIB |
Track AIA share price daily: live levels, support/resistance and our full AIA analysis history.

