Momentum Weakens, AstraZeneca Stock Gains 3.02% Today
On Agustus 19, 2026: price 11,806.00 GBp, trend downtrend, RSI 35.3, support 11,460.00, resistance 13,134.00. technical analysis of astrazeneca stock.

On the London Stock Exchange, AstraZeneca (AZN.L) rose to 11,806.00 GBp on 17 August 2026 at 14:00 WIB, up 3.02% from the previous close, but the share still sits below its short- and medium-term trend lines. That matters because the latest bounce has arrived inside a broader downtrend, with the price below SMA20 at 12,207.60 and well under SMA50 at 12,981.64, a setup that usually tells traders the rebound is not yet a confirmed trend reversal.
Trend & Price Action
The chart shows AstraZeneca trading in the lower part of its recent range, at about 21% of the 20-day band, after a weak month that left the stock 4.64% lower. That placement is important: when a share is near the lower end of its range but still below the moving averages, the market is often saying sellers remain in control even if the latest session is green.
The SMA20 is falling at -1.71% over 5 days, which reinforces the downtrend rather than flattening it. There is no fresh MA-cross, so the chart does not yet show the kind of moving-average crossover that would normally signal a more durable shift in momentum. In plain English, the price has not done enough to win back the intermediate trend.
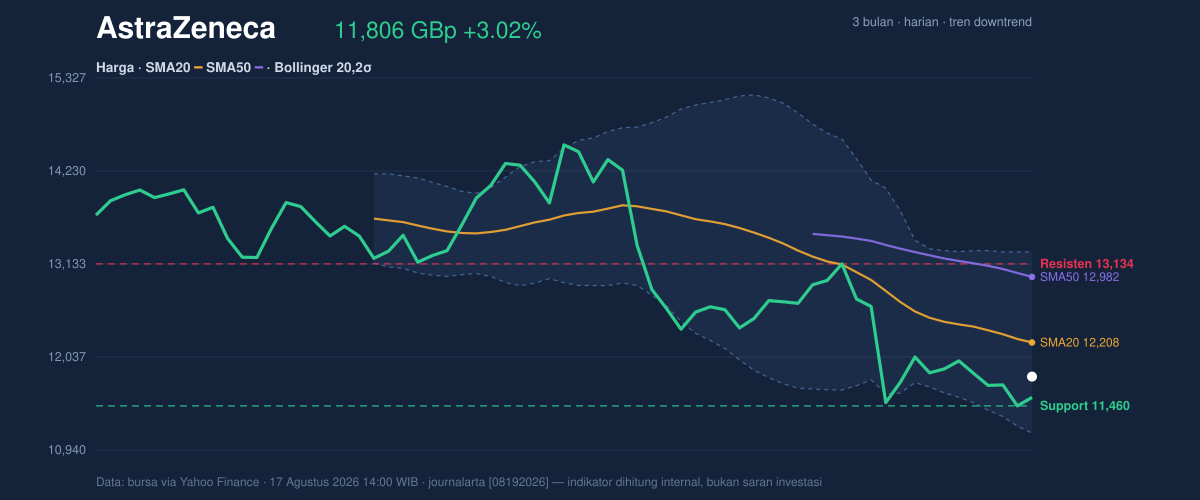
As shown in the chart, the nearest floor is 11,460.00, which also matches the previous close and the 20-hour support area. That level is now the first test for buyers, because if a rebound cannot hold above that zone, the latest move higher starts to look more like a pause in weakness than a change in direction.
Oscillators & Momentum
The momentum picture is mixed, and that mix is telling. RSI at 35.3 is still technically neutral, but it sits close to the lower edge of the range, which usually means the stock is weak without yet being deeply stretched. By contrast, Stochastic %K at 8.9 and %D at 9.6 are in oversold territory, a sign that short-term selling pressure has become intense enough to raise the odds of a reflex bounce.
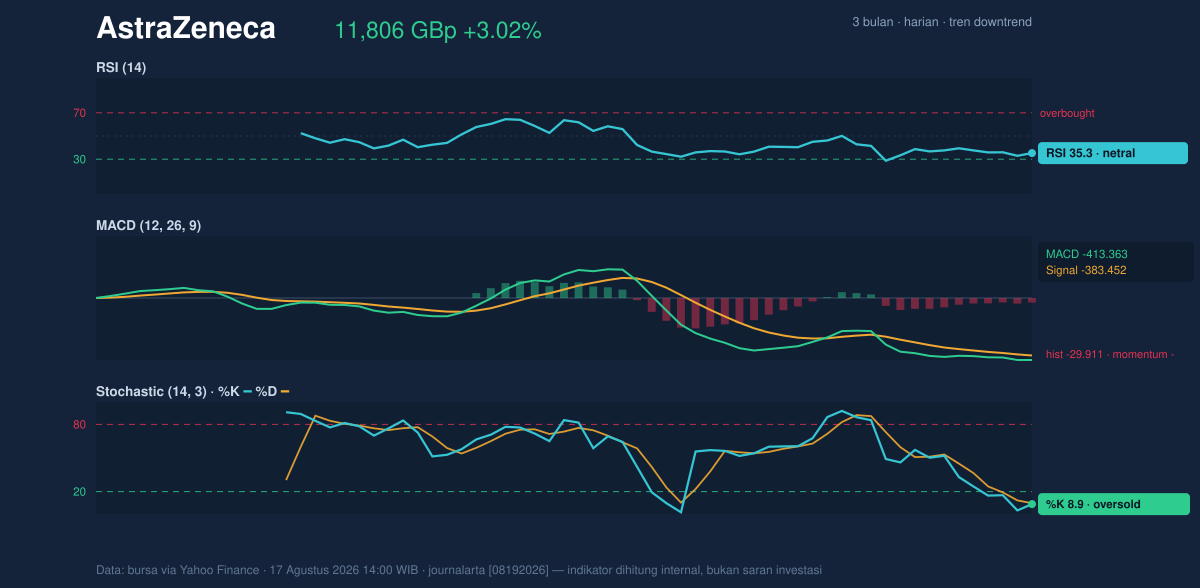
That oversold reading does not override the broader trend. MACD at -413.363, still below its signal line at -383.452, with a histogram of -29.911, shows negative momentum remains in place. For general readers, MACD is a trend-following gauge: when it stays below the signal line, it usually means downward pressure is still dominating, even if the stock is temporarily oversold.
So the signal set is split. The stochastic oscillator hints at a rebound, but MACD says the downtrend has not been neutralized. That combination often produces choppy trading rather than a clean reversal.
Volatility & Volume
Volatility is moderate rather than extreme. ATR(14) at 368.80, or 3.1% of price, suggests the stock can still move meaningfully in either direction, but not in a panic-like fashion. The Bollinger Band width is 17.5%, described as normal, which means the share is not in a volatility squeeze that often precedes a sharp breakout. The current position at %B 31% places the price in the lower third of the band structure, consistent with weakness but not yet a breakdown outside the lower band at 11,139.24.
Volume adds an interesting nuance. Last trade volume of 3,231,402 was only 0.7× the 20-hour average of 4,450,789, so the latest rise did not come with strong participation. That matters because price gains backed by light volume are easier to fade. Still, OBV is rising, which means cumulative volume flow has been improving even while the price trend remains soft. In practical terms, some investors are quietly accumulating, but not yet with enough force to change the chart’s message.
Key Levels & Scenarios
The market is now boxed between clearly defined levels. Immediate support sits at 11,460.00, followed by the Bollinger lower band at 11,139.24. On the upside, the first barrier is 13,134.00, with the Bollinger middle line and SMA20 both at 12,207.60 acting as an important checkpoint. A move back above that mid-band would be a sign that the recent bounce is gaining credibility, while failure to hold the lower support would leave the chart vulnerable to a deeper retest of the lower band.
The 3-month high of 15,126.00 and 3-month low of 9,892.00 frame the broader trading range. AstraZeneca is still much closer to the lower half of that band than the upper half, which is another reminder that the burden of proof remains with the bulls.
Technical Verdict: HOLD (wait & see)
HOLD (wait & see)
- Reason 1: The price is still below SMA20 at 12,207.60 and SMA50 at 12,981.64, so the broader trend remains negative.
- Reason 2: RSI at 35.3 and Stochastic at 8.9/9.6 suggest the stock is weak and short-term oversold, but MACD remains negative, so reversal confirmation is missing.
- Reason 3: Volume is only 0.7× normal, which weakens the credibility of the latest rise even though OBV is rising.
- Verdict invalidated if price breaks below 11,139.24, the lower Bollinger band and the nearest technical floor.
Ideal Entry Range: 11,460.00 to 12,207.60
Exit Target: 13,134.00
Stop Loss Protection: 11,139.24
In plain English, the chart says AstraZeneca is bouncing, but the trend has not yet proved that the recovery is real.
The latest support level is 11,460.00.
Summary Data AstraZeneca
| Last price | 11,806.00 GBp |
| Change 1 day / 5 days / 1 month | 3.02% / -1.53% / -4.64% |
| Trend / MA-cross | downtrend / none |
| SMA20 / SMA50 | 12,207.60 / 12,981.64 |
| RSI (14) / Stochastic %K | 35.3 / 8.9 |
| Bollinger %B / ATR | 31% / 368.80 |
| Support / Resistance 20 days | 11,460.00 / 13,134.00 |
| Data as of | 17 Agustus 2026 14:00 WIB |
Track AstraZeneca share price daily: live levels, support/resistance and our full AstraZeneca analysis history.


