Tencent Momentum Weakens: Stock Gains 0.55% (Agustus 19, 2026)
On Agustus 19, 2026: price 442.40 HKD, trend sideways, RSI 43.6, support 434.60, resistance 492.20. technical analysis of tencent stock.

Tencent Holdings traded in Hong Kong with its shares last at HKD 442.40, up 0.55% on the day, but the move sits inside a broader pullback that has left the stock 8.10% lower over 5 days and 7.41% down over 1 month, according to HKEX-linked market data via Yahoo Finance at 17 August 2026 08:30 WIB. The message from the tape is not one of fresh strength; it is one of a stock trying to stabilise after losing altitude, while buyers have yet to prove they can reclaim the trend line that matters.
Trend & Price Action
Tencent is still trading below both its SMA20 at HKD 463.37 and SMA50 at HKD 455.07, which matters because moving averages are often watched as a rough gauge of whether a stock is being supported by recent buyers or dragged by recent sellers. When price sits under both, as shown in the chart, it usually signals that rallies are still being sold rather than embraced. The absence of a new MA-cross also suggests there has been no clean shift in medium-term control. The stock’s sideways trend label, combined with a SMA20 slope of -1.00% over 5 days, points to a market that is drifting lower inside a range rather than breaking into a decisive downtrend.
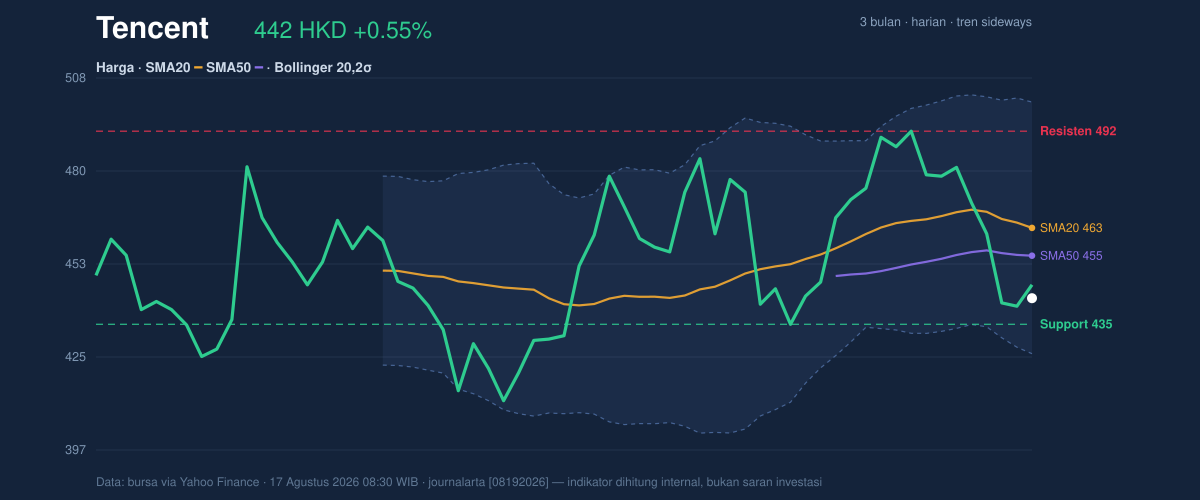
That said, Tencent is not collapsing. It is trading near the lower half of its recent range, with the last price sitting only modestly above the 3-month low of HKD 411.00 and well below the 3-month high of HKD 497.80. In practical terms, the market is saying the stock has not found enough demand to revisit the upper end of the range, but neither has it lost the floor entirely.
Oscillators & Momentum
The momentum picture is mixed, and that mix is important. The RSI at 43.6 is neutral, so the stock is not stretched to the upside or washed out in a way that usually forces a rebound. By contrast, the Stochastic %K at 16.8 and %D at 10.8 are in oversold territory, which often means short-term selling has gone far enough to invite a bounce. But oversold does not automatically mean reversal; it only tells us the stock is closer to the lower end of its recent trading band. The more decisive signal comes from the MACD at -0.748, with the signal line at 3.854 and the histogram at -4.602. That combination shows downside momentum still dominates. In plain English: the stock may be near a tactical rebound zone, but the broader momentum engine remains pointed down.
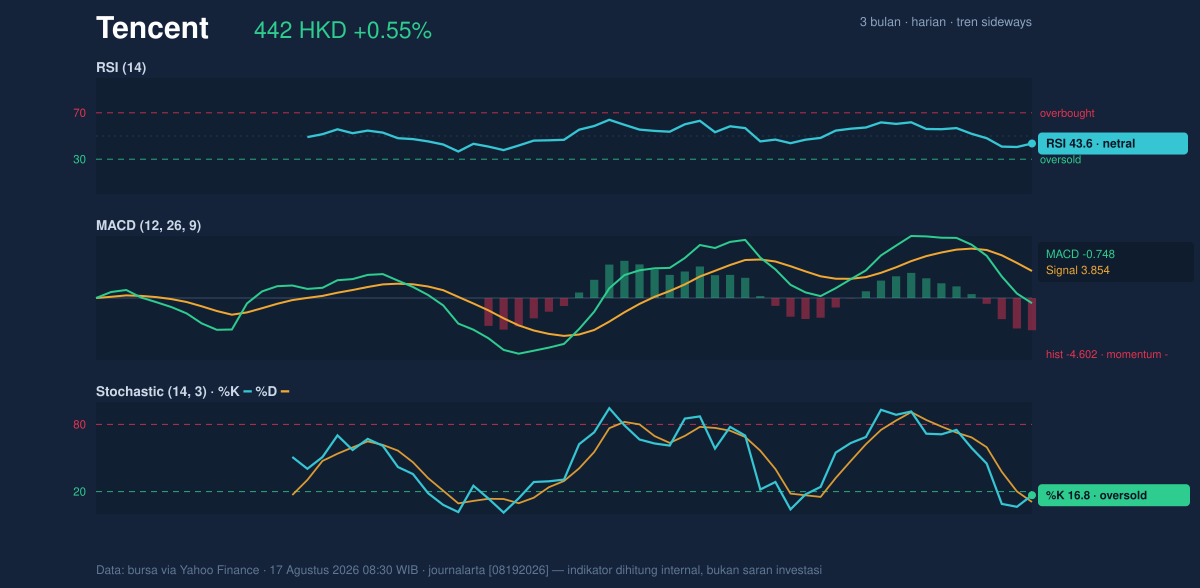
This is the kind of setup that can produce sharp but fragile bounces. Without a MACD turn, oversold readings often behave like a warning light rather than a buy signal.
Volatility & Volume
Tencent’s Bollinger Bands help frame where price sits relative to recent volatility. The stock is trading with %B at 22%, meaning it is near the lower portion of the band structure, and the lower band at HKD 425.84 is not far beneath the last price. That is significant because it places the share price close to a level where short-term traders often watch for either a stabilisation or a break lower. The band width of 16.2% is described as normal, so this is not a volatility squeeze that usually precedes an explosive move; instead, it suggests the stock is moving within an established range.
The ATR(14) at 14.00, or 3.2% of price, indicates moderate day-to-day movement. That matters because it means any break of support or resistance can travel with enough range to matter, but the stock is not in a panic regime. Volume adds a cautionary note: the latest session’s 19,842,808 shares traded versus a 20-hour average of 28,605,369, or 0.7x normal, while OBV is falling. Lower volume on a bounce is often read as weak participation; falling OBV means the balance of volume has been favoring distribution rather than accumulation. In other words, the rebound attempt has not yet earned conviction.
Key Levels & Scenarios
The nearest technical floor is the support at HKD 434.60. That level matters because it sits just below the current price and roughly marks the area where buyers have recently been willing to step in. If that support gives way, the chart opens toward the lower Bollinger band at HKD 425.84 and then the 3-month low at HKD 411.00. On the upside, the first meaningful barrier is the resistance at HKD 492.20, which sits well above the current quote and close to the upper half of the recent range. Above that, the SMA20 at HKD 463.37 and SMA50 at HKD 455.07 are not just averages; they are the first checkpoints that would need to be reclaimed to show the stock is regaining trend discipline.
If price can hold above support and recover the moving averages, the market would be signalling that the recent decline is losing force. If it fails to hold, the current bounce would look more like a pause in a broader retreat.
Technical Verdict: HOLD (wait & see)
HOLD (wait & see) is the clearest reading from the current setup because the stock is oversold in the short term but still weak in trend and momentum.
Reasons:
- MACD remains negative, showing downside momentum is still active.
- Price is below SMA20 and SMA50, so the stock has not yet reclaimed its medium-term trend markers.
- Stochastic is oversold, but RSI is neutral and volume is only 0.7x normal, which weakens the case for a durable rebound.
Verdict invalidated if price breaks below HKD 434.60, because that would signal the nearest support has failed and the stock is likely moving toward the lower band.
- Ideal Entry Range: HKD 434.60 to 425.84
- Exit Target: HKD 455.07 to 463.37
- Stop Loss protection: below HKD 425.84
For non-traders: the stock looks like it may be trying to steady itself, but it has not yet shown enough proof that the decline is over.
“The market is asking Tencent to prove it can hold the floor before anyone trusts the bounce.”
Summary Data Tencent
| Last price | 442.40 HKD |
| Change 1 day / 5 days / 1 month | 0.55% / -8.10% / -7.41% |
| Trend / MA-cross | sideways / none |
| SMA20 / SMA50 | 463.37 / 455.07 |
| RSI (14) / Stochastic %K | 43.6 / 16.8 |
| Bollinger %B / ATR | 22% / 14.00 |
| Support / Resistance 20 days | 434.60 / 492.20 |
| Data as of | 17 Agustus 2026 08:30 WIB |
Track Tencent share price daily: live levels, support/resistance and our full Tencent analysis history.


