XOM Stock Technicals Today: Gains 2.54%, RSI Overbought
On Agustus 19, 2026: price 165.56 USD, trend uptrend, RSI 70.8, support 151.63, resistance 165.56. technical analysis of xom stock. XOM Stock Technicals — full…

ExxonMobil shares rose to 165.56 on the NYSE on 18 August 2026, extending a near-term advance that has pushed the stock to the top of its recent trading band and just shy of its 3-month high of 165.67. The move matters because it is not just a one-day pop: the stock is now 2.54% higher on the day, 3.60% over 5 days and 9.13% over 1 month, which signals sustained demand rather than a single burst of buying.
Trend & Price Action
The chart shows XOM trading above SMA20 at 156.94 and well above SMA50 at 148.07, a classic sign that the medium-term trend is still pointing higher. In plain terms, the shorter average is already above the longer one and the stock is holding above both, so recent buyers remain in control even after the latest climb.
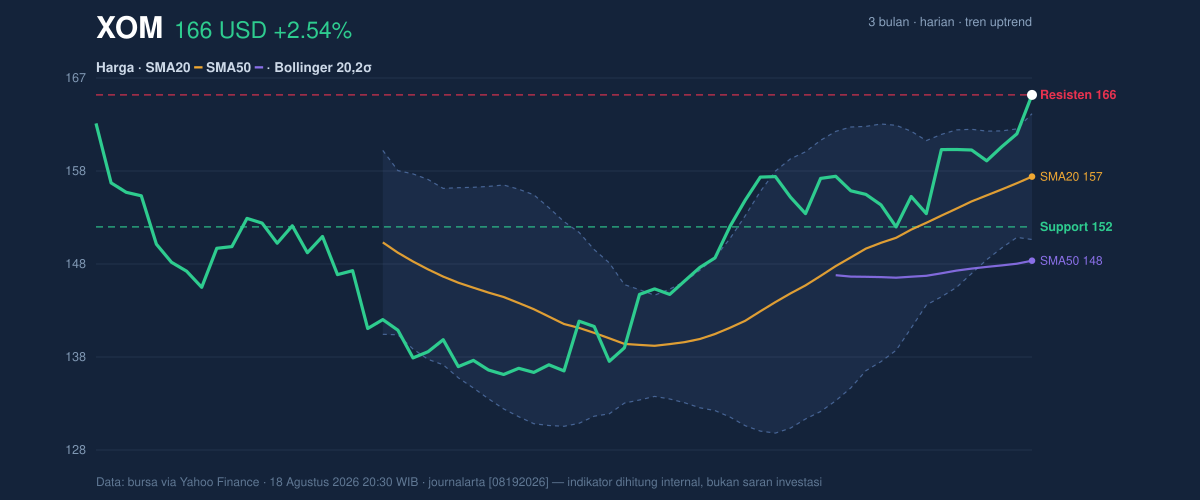
That strength is reinforced by the fact that price is sitting at 100% of the 20-hour range, with support at 151.63 and resistance at 165.56. When a stock closes at the top of its range, it usually tells you the market is willing to pay up for shares and has not yet found enough selling pressure to force a retreat. The catch is that XOM is now testing the upper edge of its own recent ceiling, so the next move depends on whether momentum can keep carrying it or whether profit-taking starts to dominate.
The Bollinger setup adds an important nuance. With the upper band at 163.58, price is already trading above that level and the %B reading of 115% shows the stock has pushed beyond the normal envelope of the 20-day band. That does not automatically mean a reversal is imminent; it means the move is stretched and the market is pricing in stronger-than-usual near-term enthusiasm. The band width of 8.5% is still described as normal, so this is less about a volatility explosion and more about a controlled trend pressing against the upper boundary.
Oscillators & Momentum
The momentum picture is strong, but it is also getting overheated. RSI at 70.8 and Stochastic %K at 99.3 / %D at 93.0 both sit in overbought territory, which means the stock has moved fast enough that short-term traders may begin locking in gains. Overbought does not mean “must fall”; it means the stock is extended and can stay extended if buying pressure remains firm.
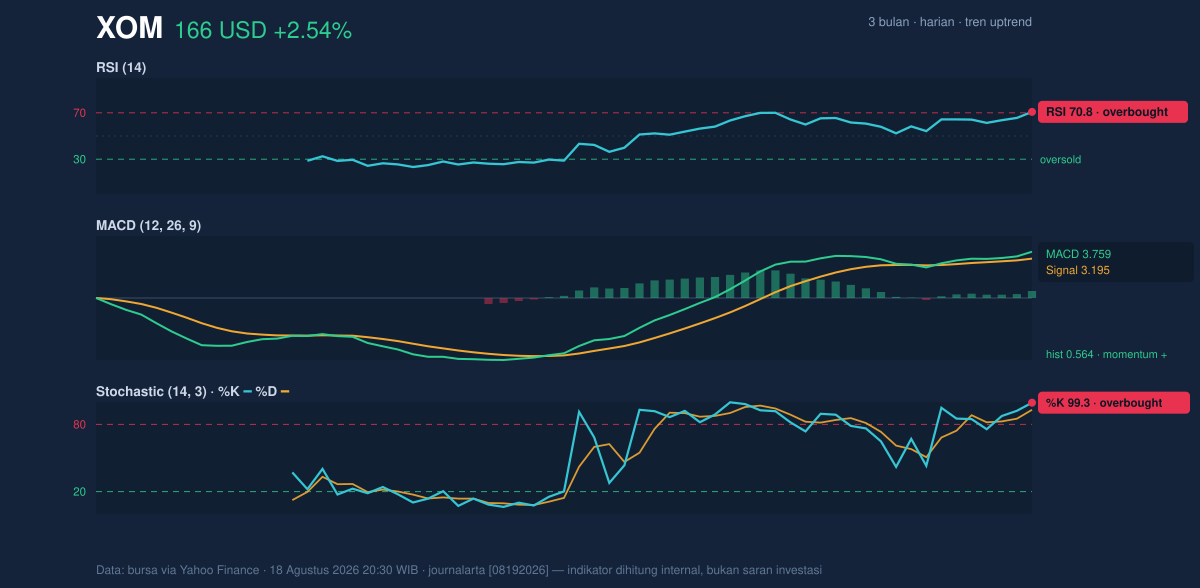
That is where MACD helps separate trend strength from simple exhaustion. XOM’s MACD at 3.759 remains above the signal line at 3.195, and the histogram at 0.564 shows positive momentum is still expanding. In practical terms, the trend has not yet rolled over; momentum is still confirming the price advance rather than warning of a breakdown. The tension between a bullish MACD and overbought RSI/Stochastic is the key story here: the trend is healthy, but it is becoming increasingly stretched.
Volatility & Volume
Volume also leans constructive. The latest turnover of 18,946,100 shares is about 1.3× normal versus the 20-hour average of 14,278,440, and OBV is rising. That combination matters because rallies backed by heavier participation are usually more credible than moves made on thin trading. Rising OBV means volume is accumulating in the same direction as price, which suggests institutions or larger participants are not standing aside.
The ATR(14) of 3.77, equal to 2.3% of price, points to moderate volatility rather than turbulence. That tells readers the stock has room to move, but not in a disorderly way. Put differently, XOM is active enough to keep trending, yet not so volatile that every session looks like a panic move.
Key Levels & Scenarios
The immediate technical map is straightforward. 165.56 is now both the latest print and the near-term resistance line, while 163.58 marks the Bollinger upper band that the stock has already exceeded. Below that, 156.94 is the SMA20 and the middle Bollinger band, which often acts as the first meaningful pivot in a trend. The more important floor is 151.63, the 20-hour support.
If XOM holds above 165.56, the market is effectively accepting a new, higher trading zone and the chart would remain in trend-extension mode. If it slips back below 163.58 and then loses 156.94, that would suggest the rally is cooling and reverting toward the center of its range. A break below 151.63 would be the clearest sign that the current advance has lost its structure.
Technical Verdict: HOLD (wait & see)
HOLD (wait & see) because the trend is still positive, but the stock is also stretched and near resistance.
- MACD remains supportive: the line is above the signal line and the histogram is positive, which says momentum is still backing the uptrend.
- RSI and Stochastic are overbought: that signals extension, not breakdown, and raises the odds of pause or pullback after the recent run.
- Price is above SMA20 and SMA50: the broader structure is constructive, but the move is now pressing against the upper Bollinger area and recent highs.
Verdict invalidated if price falls below 151.63, because that would mean the stock has lost its nearest support and the trend structure is no longer intact.
- Ideal Entry Range: 156.94 to 163.58
- Exit Target: 165.67
- Stop Loss protection: 151.63
For non-traders, this means XOM still looks technically firm, but it is already stretched enough that the chart is asking for confirmation before the next leg higher. The next development to watch is whether the stock can hold above 165.56 after this test of its 3-month high at 165.67.
Summary Data XOM
| Last price | 165.56 USD |
| Change 1 day / 5 days / 1 month | 2.54% / 3.60% / 9.13% |
| Trend / MA-cross | uptrend / none |
| SMA20 / SMA50 | 156.94 / 148.07 |
| RSI (14) / Stochastic %K | 70.8 / 99.3 |
| Bollinger %B / ATR | 115% / 3.77 |
| Support / Resistance 20 days | 151.63 / 165.56 |
| Data as of | 18 Agustus 2026 20:30 WIB |
Track XOM stock price daily: live levels, support/resistance and our full XOM analysis history.


