AstraZeneca Stock Gains 1.26%, Momentum Gains In Focus
On Agustus 24, 2026: price 12,240.00 GBp, trend sideways, RSI 49.5, support 11,460.00, resistance 13,134.00. technical analysis of astrazeneca stock.
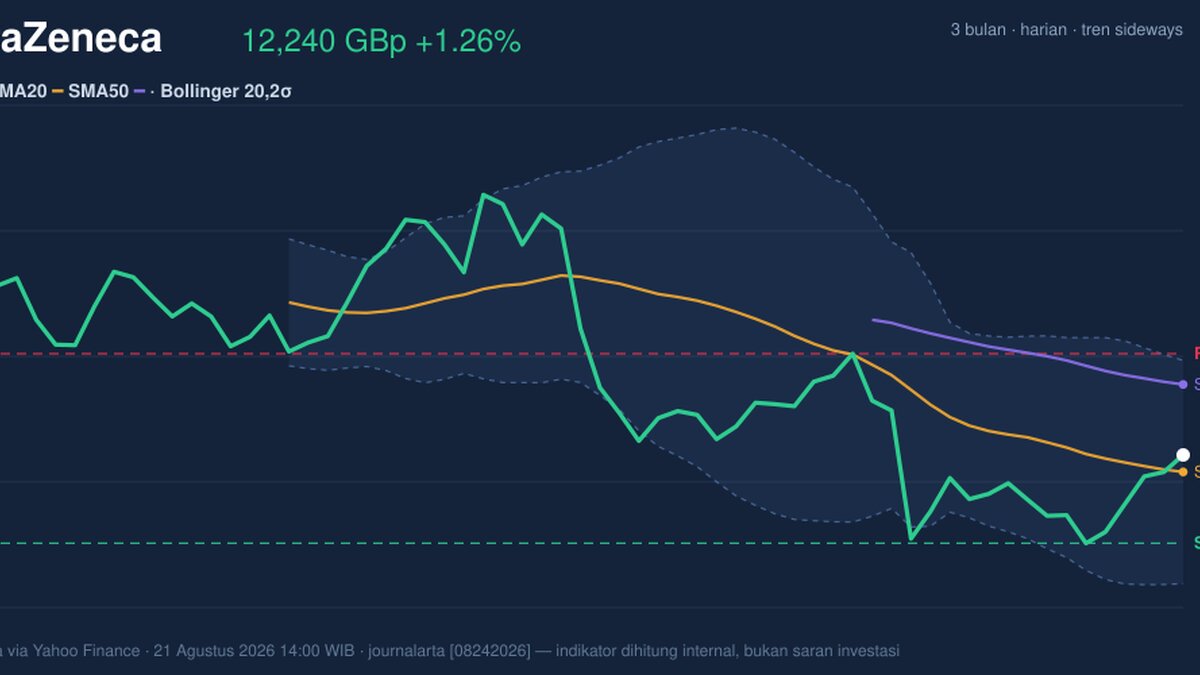
AstraZeneca’s shares on the LSE were last quoted at 12,240.00 GBp, up 1.26% on the day and 6.81% over five days, according to data via Yahoo Finance at 21 August 2026 14:00 WIB. The move matters because it has carried the stock back above the 20-day average at 12,089.20, even though the broader pattern is still described as sideways. That combination usually signals a market trying to stabilise rather than break decisively in either direction.
Trend & Price Action
The share price is now trading between its short- and medium-term averages, with price above SMA20 but still well below SMA50 at 12,862.60. That gap tells a simple story: the recent bounce is real, but the longer trend has not yet been reclaimed. In technical terms, the stock is trying to repair a softer structure without having fully reversed it.
The slope of the 20-day average is still -1.30% over five days, which is a reminder that the short-term trend remains mildly negative despite the latest recovery. There is no fresh MA-cross, so there is no new moving-average signal to confirm a trend change. As shown in the chart, the price is also sitting at about 47% of the 20-hour range, which places it in the middle of the recent band rather than near either extreme.
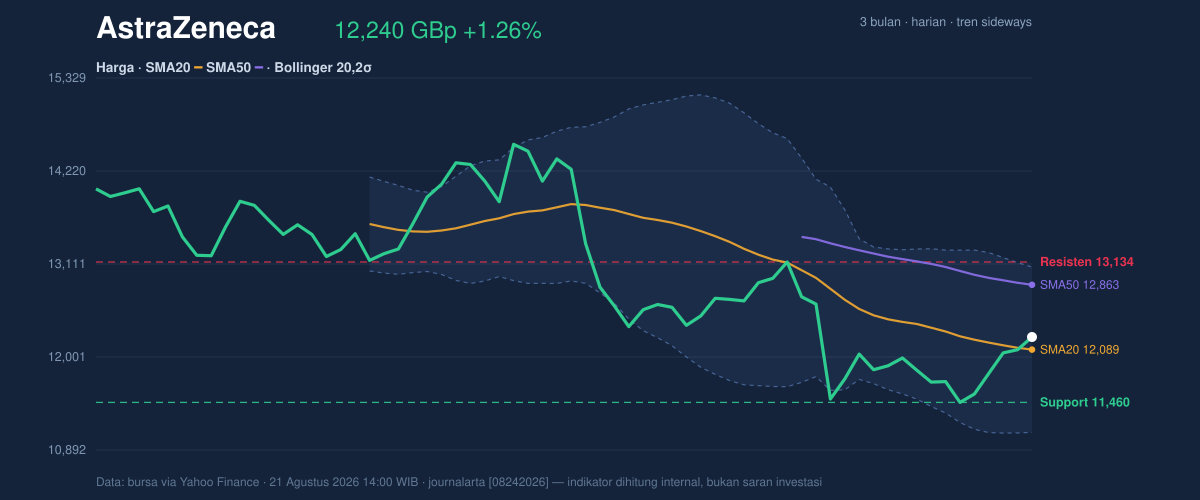
That positioning is important. A stock in the middle of its range can still move either way, but it usually needs volume or a momentum reset to pick a direction. Here, the broader 3-month range of 15,126.00 to 9,892.00 shows there is still plenty of historical room above and below, yet the current trade is not pressing either boundary.
Oscillators & Momentum
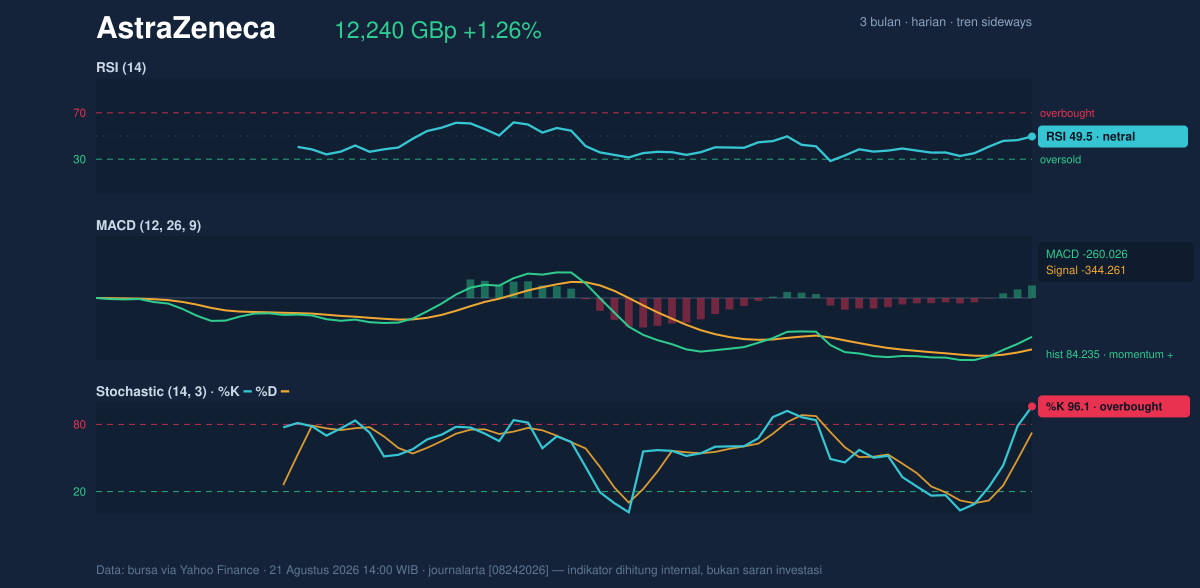
Momentum is mixed, and that is the clearest message from the indicators. RSI at 49.5 is almost perfectly neutral, which means the stock is neither overextended nor washed out on that measure. By itself, that would suggest balance. But the stochastic oscillator tells a different part of the story: %K at 96.1 versus %D at 72.7 is an overbought reading, meaning the latest rise has been fast enough to stretch the short-term tape.
That split matters. RSI says the stock is broadly in equilibrium, while stochastic says the recent bounce may be getting crowded in the near term. When those two disagree, the stronger signal often comes from the one tied to the shorter swing, which in this case argues for caution around chasing the move.
The MACD picture is more constructive. MACD at -260.026 is still below zero, so the stock has not fully escaped the weaker trend zone, but the signal line at -344.261 sits lower still, leaving a positive histogram of 84.235. In plain language, the downside momentum is fading and the stock is improving from a weak base. That is not the same as a confirmed uptrend, but it does show the recent lift has internal support.
Volatility & Volume
Volatility is not flashing alarm bells. The Bollinger Bands are normal, with a 16.3% band width, which suggests the market is not in a squeeze that would typically precede a sharp breakout. The price is at %B 58%, meaning it is slightly above the band midpoint and leaning modestly toward the upper half of the range without being near the top band at 13,074.92. That is consistent with a stock recovering, but not yet in a stretched condition on the broader band structure.
ATR, or average true range, stands at 300.51, about 2.5% of price. That points to moderate volatility: enough daily movement to matter, but not the kind of disorder that usually accompanies a panic move or a sharp trend breakout.
Volume is the weak spot in the current setup. Last trade volume was 2,344,334, only about 0.5x the 20-day average of 4,530,912. In other words, the rally is happening on quiet participation. That does not invalidate the move, but it does reduce the conviction behind it. OBV, or on-balance volume, is rising, which suggests accumulation is still present under the surface even if the day-to-day turnover is subdued.
Key Levels & Scenarios
The nearest visible support is 11,460.00, while resistance sits at 13,134.00. Those levels frame the current debate. If the shares continue to hold above the 20-day average and volume improves, the market could test the upper side of that range. If momentum fades first, the price may gravitate back toward support, where buyers have previously shown up.
The key signal to watch is whether AstraZeneca can convert a bounce into a sustained move above the nearby resistance zone. Without that, the stock remains in a sideways structure with a mildly improving momentum profile rather than a clean trend reversal. The strongest bullish clue is the MACD histogram turning positive; the strongest caution is stochastic already sitting in overbought territory while volume remains below average.
Technical Verdict: HOLD (wait & see)
HOLD (wait & see)
- MACD histogram is positive, showing improving momentum, but the main MACD line is still below zero.
- Price is above SMA20, which supports the bounce, yet it remains below SMA50, so the longer trend is not confirmed.
- Stochastic is overbought and volume is only 0.5x average, which weakens the case for immediate continuation.
Verdict invalidated if price falls below 11,460.00.
- Ideal entry range: 11,460.00 to 12,089.20
- Exit target: 13,074.92 to 13,134.00
- Stop loss protection: below 11,103.48
For non-traders, this means the shares are recovering, but the move still needs stronger confirmation before it can be treated as a lasting change in direction.
Summary Data AstraZeneca
| Last price | 12,240.00 GBp |
| Change 1 day / 5 days / 1 month | 1.26% / 6.81% / -3.39% |
| Trend / MA-cross | sideways / none |
| SMA20 / SMA50 | 12,089.20 / 12,862.60 |
| RSI (14) / Stochastic %K | 49.5 / 96.1 |
| Bollinger %B / ATR | 58% / 300.51 |
| Support / Resistance 20 days | 11,460.00 / 13,134.00 |
| Data as of | 21 Agustus 2026 14:00 WIB |
Track AstraZeneca share price daily: live levels, support/resistance and our full AstraZeneca analysis history.