ARM Stock Drops 2.71% on Wednesday, Momentum Weakens
On October 7, 2026: price 294.37 USD, trend uptrend, RSI 53.4, support 239.01, resistance 333.20. technical analysis of arm stock. ARM Stock Drops — full…
Why ARM is in focus today
- MACD histogram has just turned negative
- Uptrend confirmed (5-day change 1.63%)
- Not covered by JournalArta in the last 14 days
Selected automatically from 32 NASDAQ (US) stocks by a technical-signal score with daily weighted randomisation — not a recommendation.
Trend & Price Action
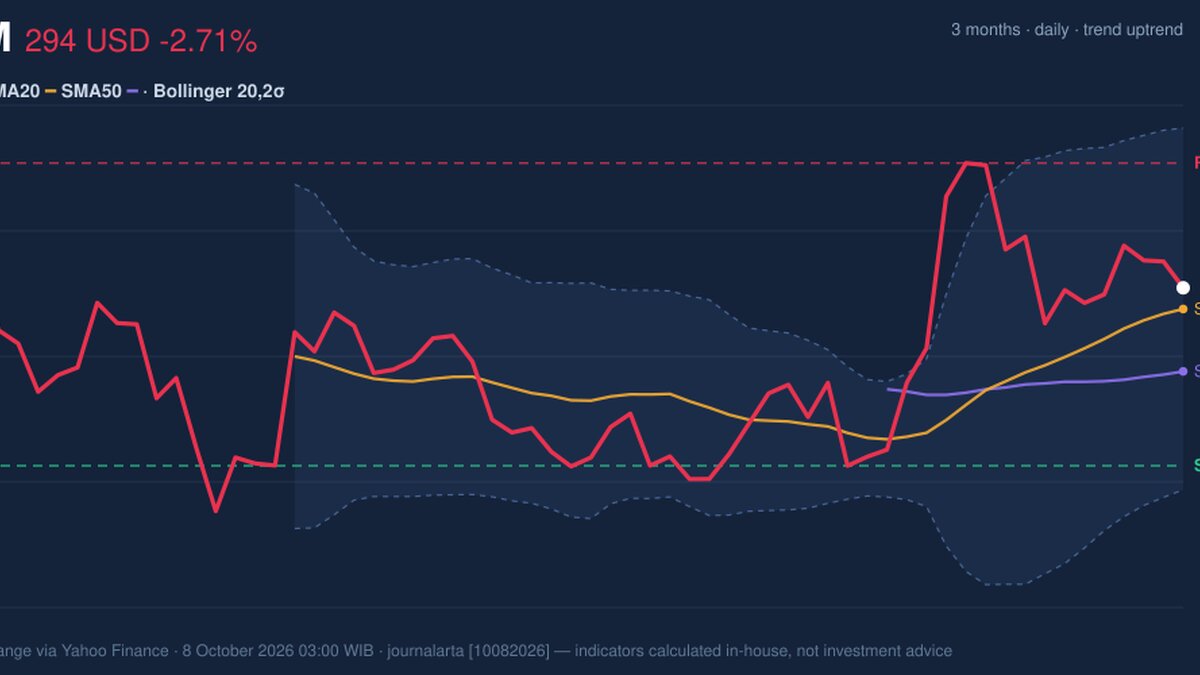
The share price is above both its 20-day simple moving average (SMA), at $287.80, and its 50-day SMA, at $268.36. A simple moving average smooths daily price moves to show the prevailing direction. The 20-day average has risen 4.43% over five trading days, while ARM gained 1.63% over that period and 11.41% over one month. Together, those readings indicate that buyers have maintained control over the recent trend, despite the latest daily decline. There has been no new crossover between the two averages, so the data do not show a fresh change in the longer- versus shorter-term trend. Instead, the immediate test is whether the price can hold above the 20-day average. A close below it would weaken the near-term structure; staying above it would preserve the current upward bias. The stock sits 59% of the way through its 20-trading-day range, between $239.01 support and $333.20 resistance, rather than near either boundary. As shown in the chart, the price remains above the Bollinger middle band, which tracks the 20-day average, but the bands are wide. Bollinger Bands mark a range around that average; wider bands signal stronger price volatility, not a direction by themselves.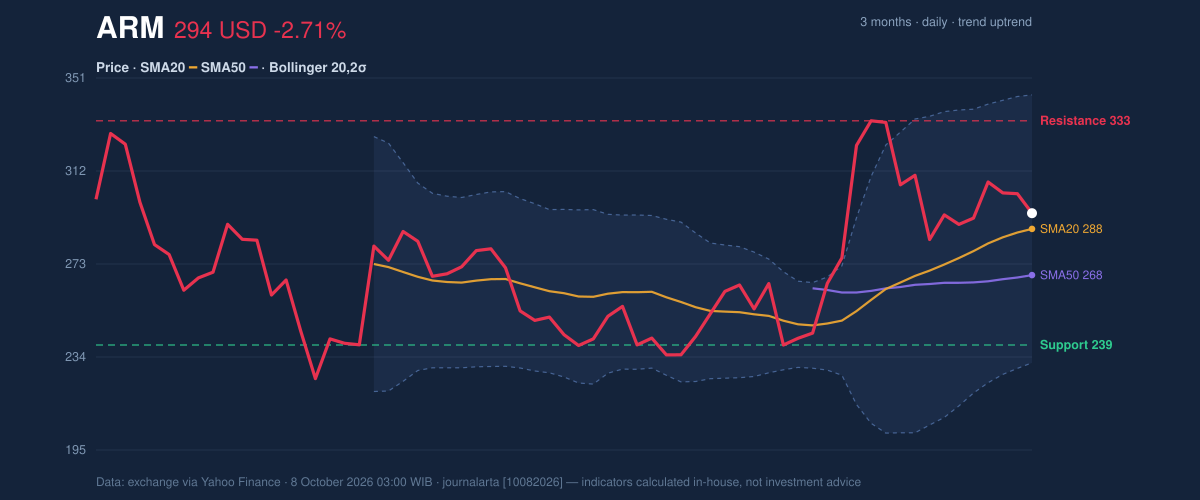
Oscillators & Momentum
The momentum indicators are mixed rather than uniformly bearish. The RSI is neutral at 53.4, while the Stochastic readings are also neutral, with %K at 43.4 and %D at 55.2. RSI and Stochastic compare recent price moves to help assess whether momentum is stretched; their current readings do not show an extreme condition that would independently confirm a reversal. The MACD sends the more cautious signal. Its value is 10.179, below the 10.571 signal line, and its histogram has turned negative at -0.392. MACD compares shorter- and longer-term price trends; a negative histogram means the shorter-term momentum has slipped below its signal benchmark. It does not, by itself, establish that the broader uptrend has ended. But alongside the daily drop and falling on-balance volume (OBV), it suggests that recent buying pressure is not being reinforced as strongly as the price trend might imply.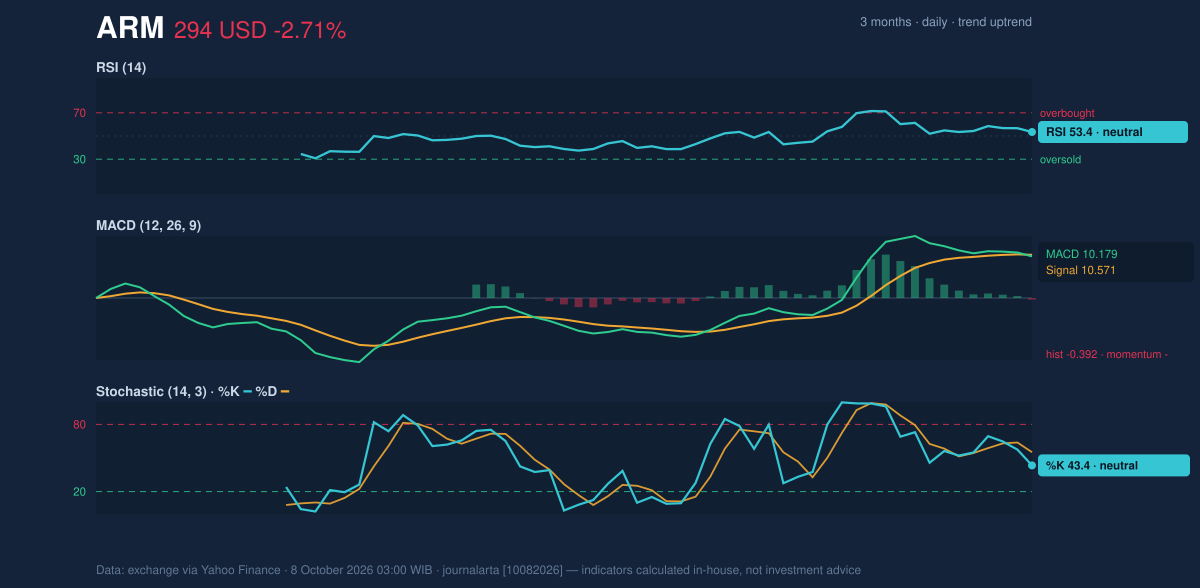
Volatility, Volume & Key Levels
Trading volume was 3,409,100 shares, about 0.6 times the 20-day average of 5,810,870. That thin turnover makes the decline less conclusive than a high-volume sell-off, but OBV is falling, indicating that cumulative volume is not confirming the rising price trend. If that divergence persists, it would make the advance more vulnerable to renewed selling. Volatility is elevated. The average true range (ATR), a measure of typical daily price movement, is $19.05, or 6.5% of the share price. The Bollinger Bands are also widening, with a 39.1% width and a %B reading of 56%, placing the price modestly above the band midpoint rather than near the upper boundary. This combination points to room for sizeable swings in either direction, not a clear signal that a breakout is underway. The three-month high of $339.44 sits above the 20-day resistance marker, while the three-month low is $219.39. A sustained move through $333.20 would bring the recent high into view; failure to hold the $287.80 moving average would put the lower range levels back in focus. The $239.01 support is a deeper 20-day reference, not an immediate forecast.Technical Verdict: HOLD
HOLD (wait & see) fits the conflicting signals. The rising SMA20 and price above both moving averages support the trend; neutral RSI and Stochastic readings do not show an established reversal. Against that, the negative MACD histogram and declining OBV argue that momentum and participation are not fully confirming the advance. The verdict is invalidated if the price falls below $287.80, the SMA20 that currently anchors the near-term uptrend.- Ideal Entry Range: $287.80–$294.37, around the SMA20 and latest price; this is a technical reference range, not a forecast.
- Exit Target (Target Price): $333.20, the 20-trading-day resistance level.
- Stop Loss protection: $268.36, the SMA50, as a lower trend-structure reference.
Summary Data ARM
| Last price | 294.37 USD |
| Change 1 day / 5 days / 1 month | -2.71% / 1.63% / 11.41% |
| Trend / MA-cross | uptrend / none |
| SMA20 / SMA50 | 287.80 / 268.36 |
| RSI (14) / Stochastic %K | 53.4 / 43.4 |
| Bollinger %B / ATR | 56% / 19.05 |
| Support / Resistance 20 days | 239.01 / 333.20 |
| Data as of | 8 October 2026 03:00 WIB |
Disclaimer: This technical analysis is generated automatically from exchange data (via Yahoo Finance) and indicators calculated by JournalArta, for information and education only. The verdict and the entry, target and stop-loss levels are not investment advice or a solicitation to buy or sell any security. Investment decisions and their risks rest solely with the reader.
Track ARM stock price daily: live levels, support/resistance and our full ARM analysis history.