Arm Stock Latest: Jumps 12.05% on Wednesday, Down 14.6% in a Month
Technical analysis of ARM stock on November 11, 2026: price 203.36 USD, trend downtrend, RSI 44.3, support 166.72, resistance 244.79.

Arm Holdings shares closed at $203.36 on Nasdaq for the session of Wednesday, November 11, 2026, a 12.05% jump from the prior close of $181.49. The rebound sits inside a bruising stretch. The stock is still down 14.56% over one month, and its five-day gain is a more modest 6.03%. The central question is whether one violent up day changes a downtrend or only interrupts it.
Why ARM is in focus today
- One-day move of 0.00%, about 0.0× its average daily range (ATR)
Selected automatically from 11 NASDAQ (US) stocks by a technical-signal score with daily weighted randomisation — not a recommendation.
Trend & Price Action
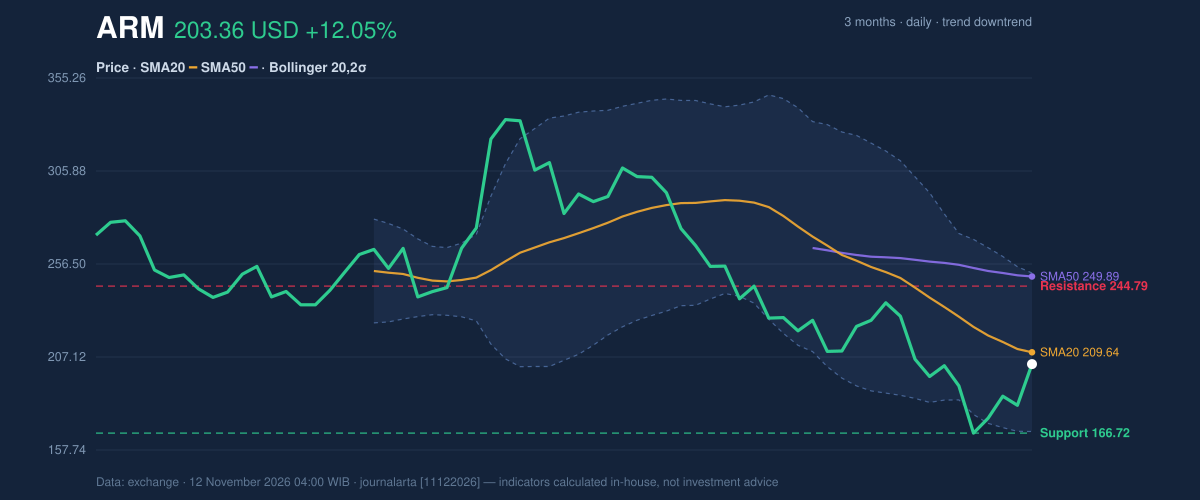
So far it looks like an interruption. The price remains below its 20-day average of 209.64, and that average sits well beneath the 50-day average of 249.89. The 20-day average itself fell 8.26% over five days, which shows how much ground the stock lost before this bounce. No new moving-average crossover has formed. The bearish alignment of the two averages is an older condition rather than a fresh signal.
The stock now sits at about 47% of its 20-day range, between support at 166.72 and resistance at 244.79. The three-month range is wider, with a high of 336.98 and a low of 163.13, so even after Wednesday's surge the shares trade far below where they were a quarter ago. As the chart shows, the 20-day average at 209.64 is the nearest ceiling, and the price has not yet closed convincingly above it.
Oscillators & Momentum
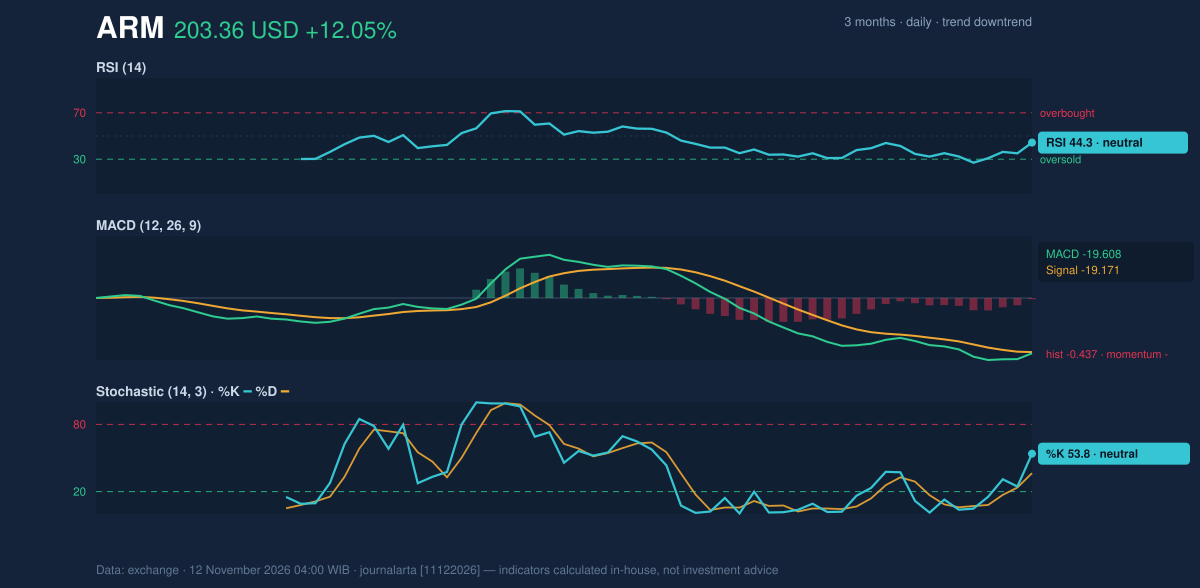
Momentum gauges have lifted off their lows but have not turned decisively. The 14-day RSI reads 44.3, in neutral territory. That is a recovery from oversold conditions, but it remains below the 50 line that usually separates buyer-led markets from seller-led ones. The Stochastic oscillator shows %K at 53.8 against %D at 36.5. %K above %D means short-term momentum is rising, yet both readings are middling and offer little conviction.
The MACD, which measures the gap between a faster and a slower average of price, stands at -19.608 against a signal line of -19.171. The histogram of -0.437 is barely negative. That means the downward momentum has almost stopped accelerating, though the indicator has not crossed into positive territory. Taken together, the gauges describe a pause in selling rather than a confirmed reversal, as the momentum chart illustrates.
Volatility & Volume
Volatility is the loudest signal on the screen. Bollinger Bands, which draw a channel two standard deviations around the 20-day average, are widening, with a band width of 40.1%. The price sits at 43% of the channel (%B), between the middle band at 209.64 and the lower band at 167.58. The 14-day Average True Range is 15.21, or 7.5% of the price. In practical terms, a daily swing of that size is ordinary for this stock right now, so a single large move carries less information than it would in a calm market.
Participation backed the jump only mildly. Volume reached 6,769,800 shares, about 1.2 times the 20-day average of 5,879,365. A 12% gain on only slightly elevated turnover suggests the move was not a broad stampede of buyers. On-balance volume, which tracks whether volume is flowing into up days or down days, is still falling. That divergence between a sharp price rise and falling cumulative volume is one reason the code's bearish list includes a bounce into the 20-day average within a downtrend.
What the Filings Add
The fundamental backdrop is firmer than the chart. According to its Form 6-K filed on November 4, Arm reported quarterly revenue of $1.44 billion for the quarter ended September 30, up 27.1% from $1.14 billion a year earlier. Net income was $130.0 million, compared with $238.0 million a year earlier, and diluted earnings per share were $0.12. Revenue growth alongside lower profit is a mix that can keep the share price volatile, because investors weigh the sales trend against the earnings decline.
Technical Verdict: HOLD (wait & see)
The JournalArta research score is -58 on a scale from -100 to +100, short of the -60 threshold that would tip it to a sell call and far from the +60 needed for a buy. The call is HOLD (wait & see), because trend and momentum are not aligned yet. The strongest reasons:
- The price is below both the 20-day and 50-day averages, and the 20-day average is below the 50-day, confirming a downtrend.
- The RSI at 44.3 and a MACD of -19.608 show that momentum has stabilized but not turned positive.
- Falling on-balance volume contradicts the strength of the one-day jump.
The following are conditional scenarios drawn only from the reference levels:
- Upside scenario: a daily close above the 20-day resistance at 244.79 would be the first sign of a trend change. The 3-month high of 336.98 would then be the outer reference.
- Downside scenario: a break of the 20-day support at 166.72 would put the 3-month low of 163.13 in play. The lower Bollinger band at 167.58 sits just above it.
- Near-term range: one ATR-based band runs from 180.55 (price minus 1.5×ATR) to 226.17 (price plus 1.5×ATR).
- Invalidation: the neutral stance is invalidated by a close beyond either 244.79 or 166.72.
For non-traders: the stock bounced sharply, but the longer slide has not been reversed, so the data say to watch for confirmation rather than assume the worst is over.
Summary Data ARM
| Last price | 203.36 USD |
| Change 1 day / 5 days / 1 month | 12.05% / 6.03% / -14.56% |
| Trend / MA-cross | downtrend / none |
| SMA20 / SMA50 | 209.64 / 249.89 |
| RSI (14) / Stochastic %K | 44.3 / 53.8 |
| Bollinger %B / ATR | 43% / 15.21 |
| Support / Resistance 20 days | 166.72 / 244.79 |
| Data as of | 12 November 2026 04:00 WIB |
| JournalArta research verdict (score) | Hold (-58) |
Today's full Buy and Sell list for US stocks →
Disclaimer: This technical analysis is generated automatically from exchange data and indicators calculated by JournalArta, for information and education only. The verdict and the entry, target and stop-loss levels are not investment advice or a solicitation to buy or sell any security. Investment decisions and their risks rest solely with the reader.
Track ARM stock price daily: live levels, support/resistance and our full ARM analysis history.